Using the 52-Week High To Build a Momentum Strategy

Unlike what Eugene Fama and other efficient markets supporters seem to believe, investors are human, endowed with limited rationality and scarce resources. The human brain just can’t process all financial information that is available in the market at all times, because its capacity is limited. Investors must make investment decisions with incomplete information and there is a strong reason to believe that prices come incomplete and thus inefficient.
But, if the efficient markets supporters were around, they would certainly argue that even in the presence of noise traders, who trade on biased expectations, the final outcome may be efficient, as there is always a group of informed investors that will cancel the noise traders’ behaviour and lead prices towards equilibrium. Failing that, we still have the arbitrageurs that would quickly take advantage of any pricing inefficiencies and allow prices to converge to their intrinsic values, thus eliminating the bias created by noise traders. There is always some adjusting mechanism, an invisible force, leading towards efficiency!
While such a framework would be perfect and desirable, it comes more as a convenient simplification from which it is easier to build models than as a comprehensive explanation for what goes on in the complex real world. For more than two decades, academics have been reporting evidence that challenges the efficient markets hypothesis, showing that price bias does exist and indeed tends to persist over time.
The human brain is limited and guided by emotion. We aren’t emotionless computers with a pre-formatted answer for each set of conditions. We form wrong beliefs about the future because we suffer from overconfidence, optimism, wishful thinking, conservatism, representativeness, anchor-and-adjustment bias, availability bias, and many other cognitive dysfunctions. Information is expensive to acquire and asymmetric and, as I mentioned above, investors are not able to process large amounts of it. Most investment decisions are taken under a limited framework and thus are often biased.
At the same time, and even though there are some informed investors in the market that could drive prices back to rationality, they often refrain from doing just that because the noise introduced by biased traders is another source of risk for them. Just because you realise that prices are above fundamental value, it doesn’t mean you’re willing to bet your house on them converging. As the saying goes, the market can remain irrational for longer than you can remain solvent. A rational arbitrageur may not jump into the market as soon as he sees price divergence and in fact he may prefer to join the irrational side of the market, contributing to drive prices to an even more irrational zone. After all, the smart money is smarter than the crowd and suffers from the optimism bias believing that it is possible to exit the market before all others do, at the earlier stages of a crash. What remains then, is an inefficient market guided by sentiment, where there is no reason to believe that prices are always guided to their intrinsic values. By managing a portfolio it is indeed possible to reap above average returns.
One of the most studied sources of profit is momentum. Several researchers have documented that a simple strategy of buying the highest past performers and selling the lowest past performers can derive future excess profits. It has been shown that these strategies work over long periods of times and drive persistent profits. Nothing could challenge the efficient market hypothesis more. An efficient market wouldn’t allow for such a naive strategy based on past prices to generate consistent profit.
In 2004, two academics, George & Hwang, went a step further on momentum and reported that we don’t even need to collect past performance to develop a momentum strategy. Comparing current price with the 52-week high may be all that is needed to outperform the market. They built a straightforward ratio to measure the proximity of a share price to its 52-week price high (price/52-week high) and rank stocks from highest to lowest. Then the strategy simply consists of buying the shares with the highest ranks while selling those with the lowest. They found that this strategy outperforms the market, as well as the traditional momentum strategy based on past performance, and that profits don’t reverse in the long term. So, an investor buying shares near their 52-week highs and keeping them for long intervals is expected to outperform.
The idea behind the 52-week high has support in psychology. As I mentioned above, investors suffer from several biases. The human brain can’t digest everything at once, and investors have limited attention spans and use anchoring. The 52-week high is a widely available metric that serves as an anchor for investment decisions. When the current price is near the 52-week high, it is likely that the stock has been experiencing some good news in the recent past. But, investors react slowly to this sporadic news and take time to adapt, because they suffer from conservatism. At the same time, the 52-week high is often seen as a psychological barrier and investors refrain from bidding on these high prices, as has been documented in several academic studies (and also reported in technical analysis). Of course, in Fama’s rational world, the proximity to some high price shouldn’t matter one bit. The price should reflect fundamental value and this value has nothing to do with price levels, proximity, or moving averages, and shouldn’t follow any persistent pattern. Value derives from the ability of a company to create future cash flows. If some good news arrives and that news increases the expected future cash flows, then there’s no reason for the share price to rise more or less depending on its proximity to the 52-week high. But, in a less-than-rational and inefficient world, the price would more quickly fully adjust to any good news if it were more distant from its 52-week high than if it were nearer. Bidding on prices near 52-week highs gives the uncomfortable feeling of buying at expensive levels, because a trader naturally compares the price with some readily available metric, which the 52-week high fits very well. That’s a bias!
So, one could say that the proximity to the 52-week high measures the degree of under-reaction. The nearer the price is to its 52-week high, the higher the likelihood for the stock to have been experiencing under-reaction to recent good news. Some sporadic good news may have been pushing prices higher towards the 52-week high, but due to conservatism and anchoring bias, it is likely there was an under-reaction. As long as good news continues to flow, prices will converge. Because prices converge slowly (and not immediately), past data can predict future returns.
But the story of the momentum strategy goes on. In 2012, Li and Yu refined the 52-week high strategy. They said the historical high may be used in addition to the 52-week high to better predict future returns. They find that, while the proximity to the 52-week high predicts future positive returns, the proximity to the historical high predicts future negative returns. Unlike the proximity to the 52-week high, which tracks under-reaction, the proximity to the historical high tracks over-reaction. When the current price is far from its historical high it is more likely because the company experienced a prolonged period of bad news. Psychology, from which behavioural finance borrows, says that this is exactly when investors tend to over-react. When mixing the over- and the under-reaction factors, an investor ends up with a far better way of capturing momentum. The idea can be resumed as follows. When a company experiences a sporadic period of good news, the share price rises and moves closer to the 52-week high. Because of the under-reaction effect depicted above, future returns are predicted to be positive. But this effect is greater when the proximity to the historical high is lower. When price is far from the historical high, it is because the company has experienced a series of bad news in the past. Due to conservatism, investors adapt slowly, and then need time to adapt to a new setting where good news is the new pattern. When the share price is closer to the historic high, it is less likely that the company has experienced a series of bad news in the past and thus also less likely conservatism plays any role.
In the end, Li and Yu find that one can use a double-sorting technique to build momentum portfolios. They sort companies by their proximity to the 52-week high (descending) and divide the dataset in quintiles. So they have five datasets, ranging from high to low proximity to 52-week high. Then they sort the stocks within each of the five datasets by their proximity to the historical high (ascending). They again build five portfolios within each initial quintile. The main idea is then to buy the stocks with low proximity to their historical high and sell the stocks with high proximity to their historical high, within each quintile.
Let’s say we have the FTSE350 universe of stocks. I could sort the stocks by proximity to 52-week high and then divide it into a few datasets. One strategy could be to select as the first dataset the stocks for which the proximity to 52-week high is higher than 0.90. Then I should rank this data by proximity to historical high (ascending). In the end I could buy the five stocks in the top and sell the five in the bottom.
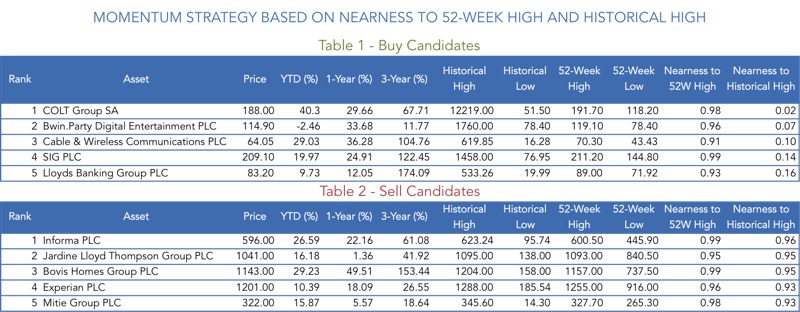
I could then go down in proximity to 52-week high, let’s say choosing stocks between 0.6 and 0.90 and do the same as depicted in the table. Then again for another group. But, there are other alternatives. There are many different alternatives depending on the number of shares I want to add. There are also some ways to refine this even more and to build a true momentum portfolio to catch the irrational persistence of the market that many still fail to recognise.
Great article Filipe. I actually live in Taiwan, the home of the researchers who did this study. I am considering interviewing them to more deeply understand their theory.
Would you be interested in asking them any questions?
What is not clear to me is the best time to sell. I think Li and Yu just hold for 6 months, but I would guess drawing a long term weekly chart support line might yield better results.
You said – “There are also some ways to refine this even more and to build a true momentum portfolio to catch the irrational persistence of the market that many still fail to recognise.”
Would you mind sharing any of these with by email. Thanks, Simon