Market Failure?

One of the key things in trading is to be able to anticipate what may happen, because preparation is everything. Not every signal will develop into an expected outcome, but once they start lining up you can be increasingly more confident that something is going to happen.
We’ve been in a bull market for some 6 years now. One of the problems with markets is they can only really do three things: up, down and sideways. That’s a problem, not in terms of analysing them, but because it looks deceptively easy with so few possibilities. As a result the world and his wife will weigh in on saying when that change is going to occur. And when it happens there will inevitably have been someone who happened to mention it on the right day at the right time, but most likely without any really sound reason for saying so, and more so, saying it at that time.
In the last 6 years, which has been to some extent a fake market (zero interest rates creating ‘bored’ money that drifted into the stock market because of appalling returns at banks, rather than stunning returns in the markets) and a fake economy packed with zombie companies that should have gone to the wall years ago, and only exist by the grace of near-zero interest rates.
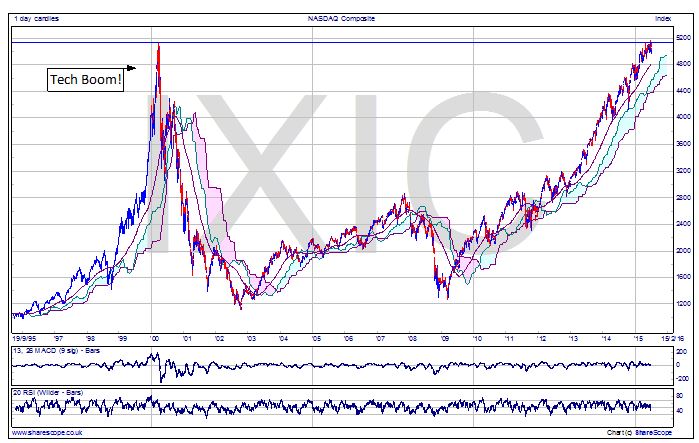
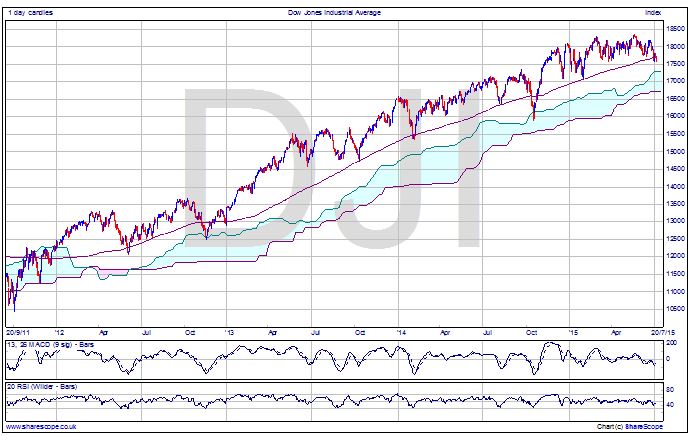
There are a couple of interesting index charts in the US right now. Firstly, the NASDAQ, which is flirting with its ATH from the Tech Boom days, and the Dow Jones which has been trundling along sideways all year, around its own ATH, in the 18,000 territory. These could be signs of either a pause, or a reversal. 6 years is a long time, but alone it’s not enough. So I went looking for some signs of weakness in key US stocks. And I wasn’t disappointed.
It was no surprise that the NASDAQ took off first in the present rally: it’s based on the hot air and high margins of companies like Google with no actual assets, certainly not in terms of stock! It would be reasonable to expect the first signs of weakness there too. And what do we see on the Google chart? Well, lower highs, and close to the support from the gap up last autumn at just below $500 – and the Americans love round numbers so do expect support there and a very likely place for support to become resistance – but a current price of around $520, with minor support at this price level. It’s also fallen below the Ichimoku cloud, a sign of weakness and has also tested that $490 support level twice in the last year. A fall below that would be a very weak sign.
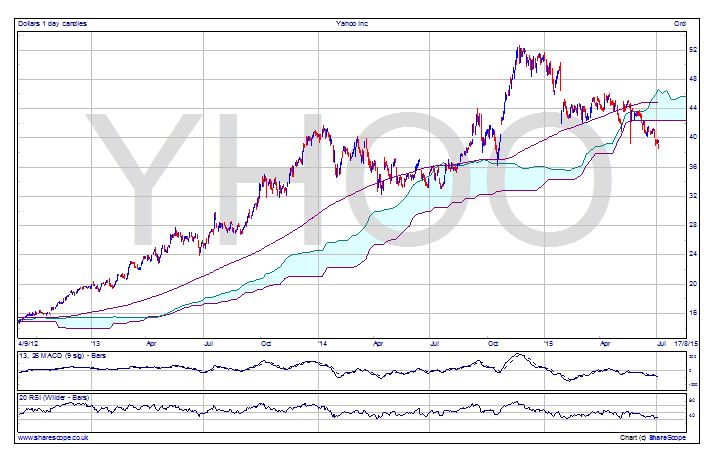
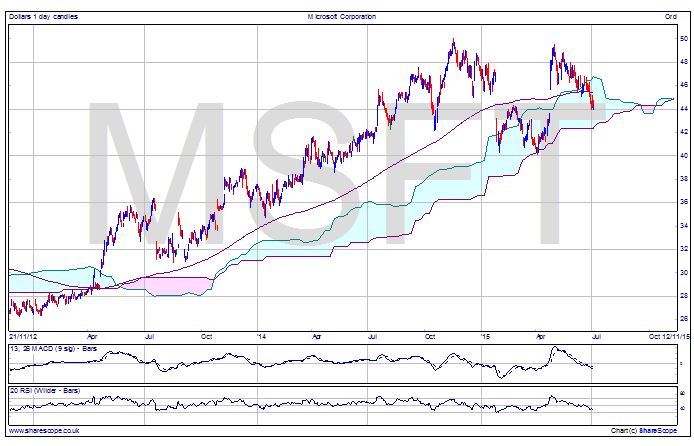
Yahoo is showing weakness too. It gapped up then shot up in what looks very like the death throes of an exhaustion rally and, after a gap down, is also below the cloud and looking weak. Miscrosoft, is another interesting one. It’s resisting failure but in doing so has made a double top. Right top slightly below the first. It’s not a strong sign. In the cloud and with the cloud base rising, and a tendency once entering a cloud for a price to cross it, I’d suggest that Microsoft will be heading below the $44 level quite soon, by which I mean this summer. And the gap has closed that made the island of the first quarter of 2015. If it fails at $44 it’s got some support at $40 but then it’s really anyone’s guess. $31? $27?
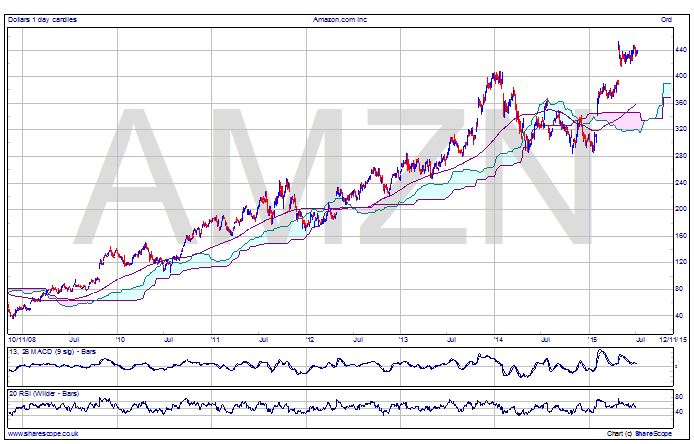
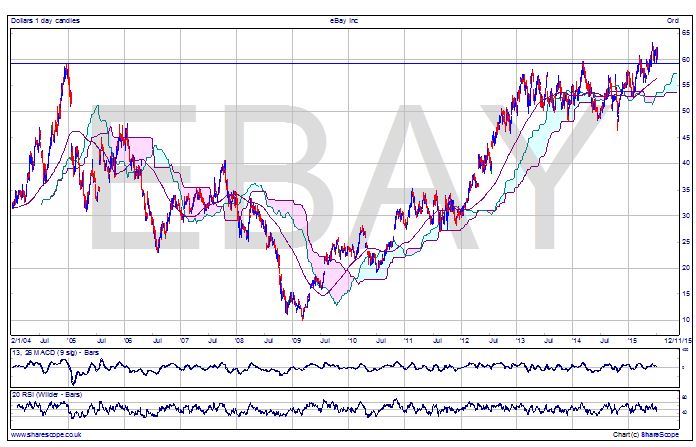
The only leviathan of the US market that I looked at that is in good condition is Amazon. The gap up on Amazon could be great if it can keep going, but I fear it’s congesting there which could mean a failure, and even a gap down. I don’t think I’d want to buy it right now without some other more positive factors. Ebay is more positive, and like Amazon sell such a range of products that they are diversified in a sense. It could also be finding support at the old ATH from 2004 and the more recent of 2014, which would be very bullish.
Of course being in the UK means if we’re not using spread bets or CFDs then we do have currency risk, and with cable at $1.54 as I write, I don’t think I’d want that unhedged against dollar denominated holdings.
Incidentally, you might think a lot of the charts I’m using are incredibly long time frames, but when we’re looking at a 6 year bull market it’s pretty much required to get perspective.
Are the ducks lining up for a bear market after so long? I’ll be watching and waiting…
Comments (0)