Commodity prices are in the hands of central banks and China

As seen in the February edition of Master Investor Magazine.
Past mistakes guide future pain
The rampant decline in commodity prices that started two years ago seems to have finally put an end to the epic boom most commodities experienced during the early part of this century. Almost no commodity has escaped the furious price correction and prices are yet to find a floor. While the current oil price near $30 seems too depressed by this century’s standards, it still looks high by 1998 standards, when oil prices could be found at $10. The current slump is an overreaction, but so was the prior boom. The last thirty years have been marked by double-digit Chinese growth and an artificially low level of interest rates, both of which helped to create a commodities boom that changed the global economy. But the time for a reversion in policy has come and the commodities market is at risk of fully reverting to its 1990s levels.
The latest data show a deceleration in Chinese output growth to a 6.9% level, while in the US interest rates have finally been hiked after years of being held at zero. Both are still at expansionary levels, but judging by the latest price developments, this hasn’t been enough to prevent the global economy from turning upside down. With the previous status quo only ever so slightly challenged, one wonders what could happen if the Chinese were to allow for full deleveraging and for monetary policy to revert to normal levels. Current conditions pinpoint the relationship between heavy economic stimulus and asset prices. In applying that logic, we can see how harmful prolonged distortions may become at the time they are reverted. During the last three decades we have witnessed aberrant policy decisions that, whilst hiding inside a Keynesian casing, called for active public intervention to smooth the business cycle. But this has merely served to exacerbate the boom and bust cycle – which would never have been backed by Keynes.
Faced with exploding Chinese demand for commodities and prolonged near-zero cost of capital, commodities producers invested heavily in new exploration. Super mines were established around the world and unexplored, expensive areas were added to the global supply. This resulted in a massive increase in supply levels that will now take years to correct. A good example depicting the madness is the investments made by three commodities giants: Vale, BHP Billiton and Rio Tinto. From the turn of the century, they expanded their combined capacity from 195 million tons to 1.1 billion.
But expanding or contracting capacity is something that may take years in the commodities sector. Companies need to invest heavily for many years, to start reaping the benefits only much later (if ever). Only when they feel that demand growth is picking up for the long term are they willing to expand capacity. In the short term, adjustment is manly processed through prices. By a similar token, these companies only reduce capacity if they believe there is a long-term reduction in demand, and then it takes time for the sector to react to decreasing demand. On one hand, the current low prices may be enough to prevent new companies from entering the market and for the existing ones to delay approved projects; but on the other hand, these prices are still not enough to lead to quick cuts in production levels.
Just look at the example of miners. The very high sunk costs incurred to develop a new exploration project prevent new companies from entering the market at this point. But for all those already in the market, sunk costs don’t enter their profit equation anymore and thus it may still be better for them to continue producing rather than abandoning mines. Supply is inelastic and the burden of the adjustment process lies almost entirely in prices over the short to medium term. Under these circumstances it should not be a surprise that price action is usually wrapped with drama, as it recently has been.
An extended bear market
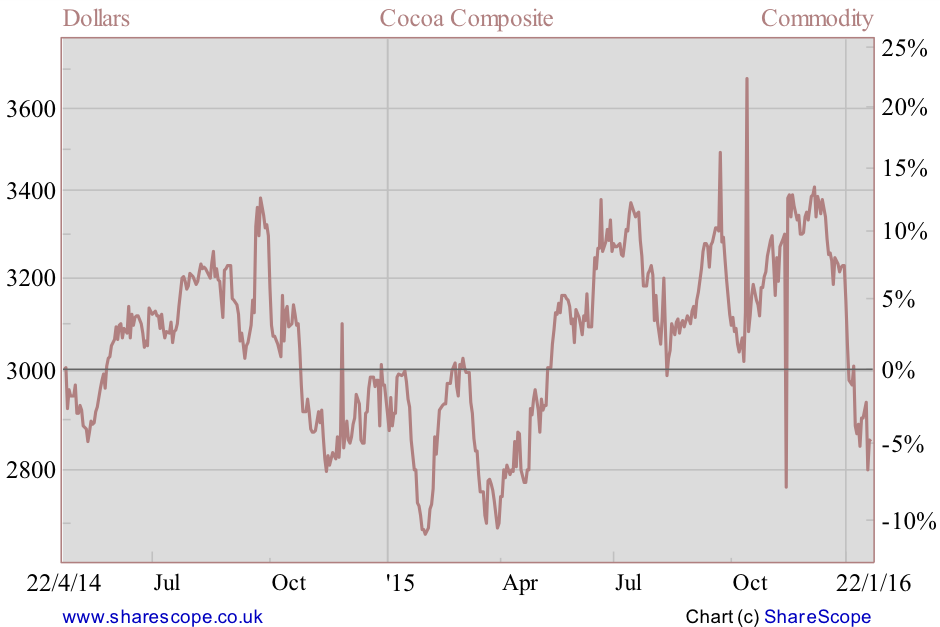
In a list where I track a dozen commodities, a two-digit red number fills almost every instance in the performance column. Oil leads the losers table showing a 70% loss, followed by iron ore with a loss north of 65%. In the sub-sector of metals, copper is down 40%, silver 30% and even the ‘safe haven’ gold is down 11%. The only exception on the list is cocoa, which is up 6% for the two-year interval.
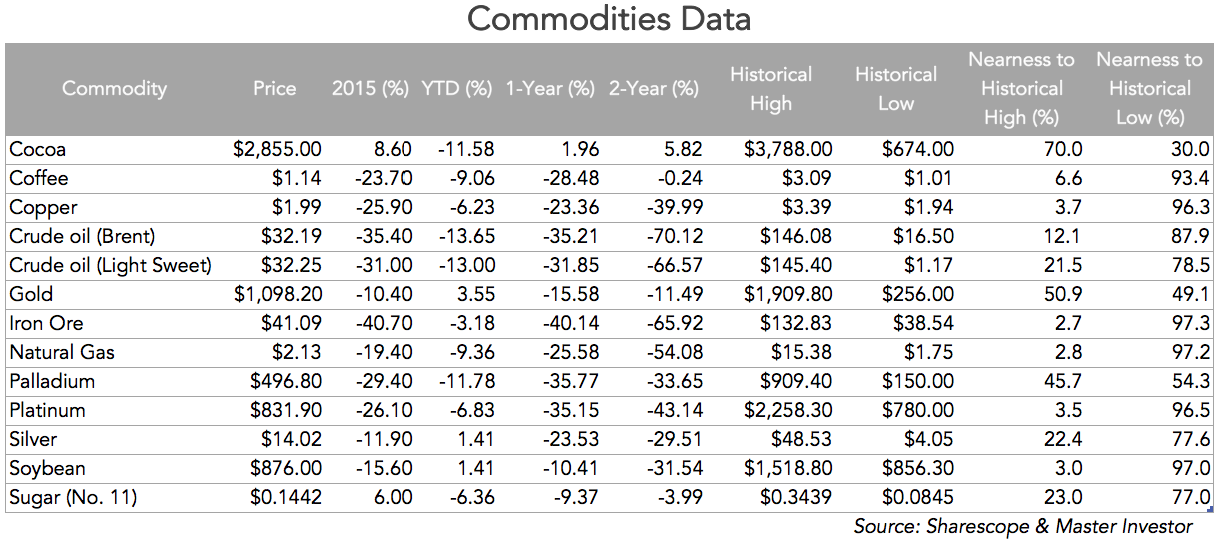
One way to evaluate the extent of the recent price declines is to look at what I like to call “relative proximity to historical high ratio” and “relative proximity to historical low ratio”, which measure the closeness (or proximity) of current prices to their historical limits. The first measure is calculated as (current price – historical low) / (historical high – historical low) while the second is given by (historical high – current price) / (historical high – historical low). If current price is near its historical high, the relative proximity to historical high would then be close to one while the relative proximity to historical low would be close to zero.
By looking at the relative proximity to historical low ratios for the dozen commodities I cover, we quickly perceive how deep the current price correction has been. Coffee, copper, iron ore, natural gas, platinum and soybean all show a figure above 0.90. Brent and light sweet oil show a figure of 0.88 and 0.79 respectively. At mid-range we have gold and palladium. Cocoa is the exception in the list, as the commodity is nearer its historical high. The overall picture depicts a depressed market where price action is nearing historical lows.
A boost from China and central banks
The Austrian school of thought usually attributes a bust to a period of bad allocation of capital due to artificially low cost of credit and an unsustainable increase in the money supply. They claim that the interest rate is the free market mechanism by which resources are allocated in the economy. When the rate is artificially set by a central bank, it loses its informativeness and decisions are taken on forged figures. But that’s exactly the aim of public policy: to force more consumption and investment than the economic conditions advise. When interest rates are lower than the levels resulting from the interaction of free market forces, too much capital is deployed to capital goods. Companies invest in long-term projects instead of producing consumer goods.
During the most part of the century, rates have been low while at the same time the Chinese authorities heavily invested in infrastructure capacity to keep their economy growing at two-digit rates. From $1.2 trillion in 2000, Chinese GDP grew to $3.5 trillion in 2007 and to $10.4 trillion in 2014. Such spectacular growth could never be the result of productivity improvements alone; it could only be the result of an astonishing credit creation that increased the national debt from $1 trillion in 2000 to $25 trillion in 2014. The huge growth experienced by China boosted the appetite for commodities, in particular for those that are important inputs in manufacturing, pushing their prices higher and seducing companies around the world to invest heavily in new mines. But with debt rising from 1x to 3x GDP, one can easily speculate that the current trend is unsustainable. China has been borrowing too much from its own future and boosting an artificial demand for commodities. This process now seems to be unwinding.
What to expect
Whether price declines have reached their full extent or not depends on the path taken by monetary policy and China’s tolerance towards lower growth. In the meantime, it is possible that the US delays rate rises to counter some volatility, but policymakers will be unable to dampen the adjustment in the medium term. At the same time, the infrastructure spending, easy credit conditions and heavy exporting that boosted Chinese growth in past decades are losing effectiveness.
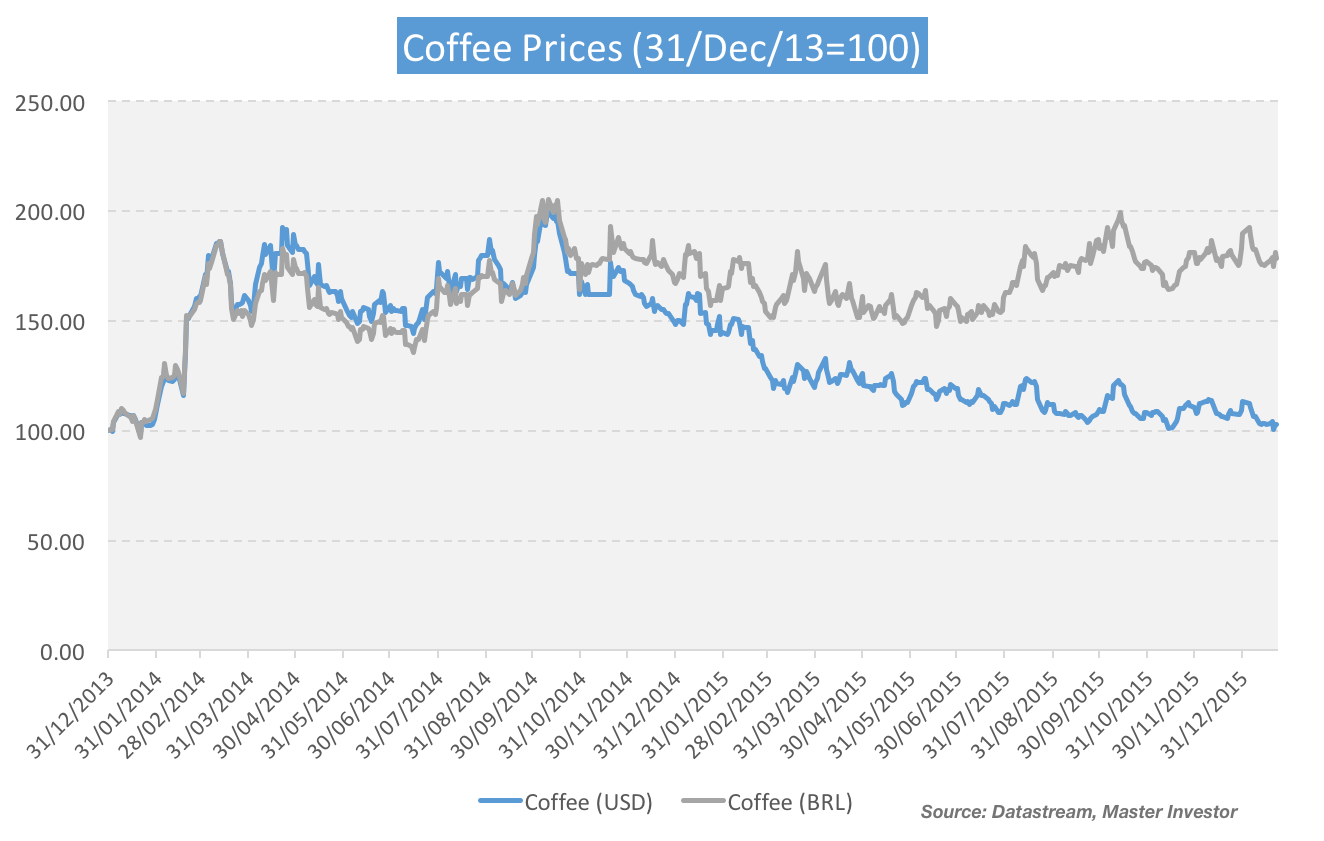
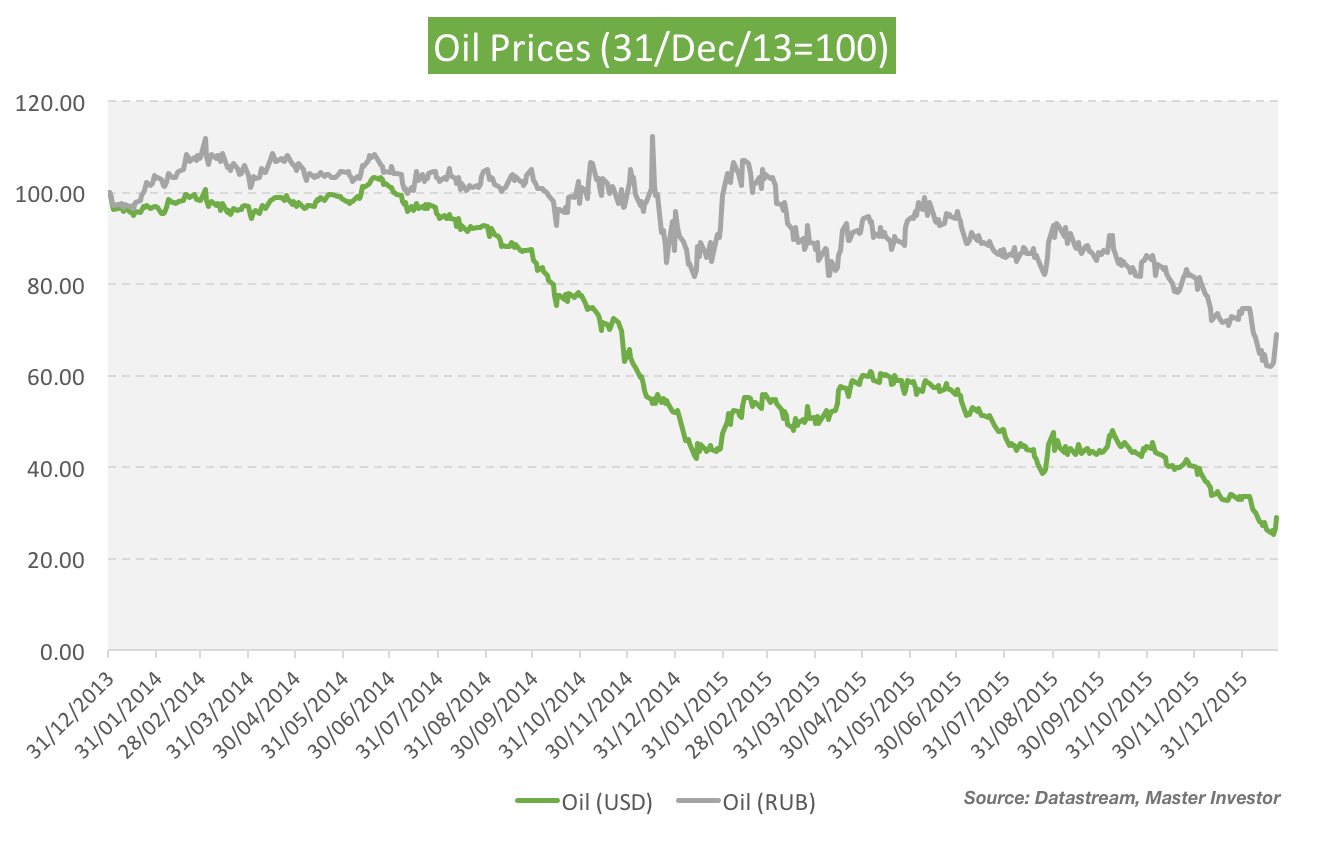
Until today, the adjustment has mainly occurred through prices, as the effects of delayed and mothballed projects still need time to be felt in supply levels. But the adjustment in prices has not been as steep as many think because commodities are traded in dollars and produced in countries where the US dollar is not the official currency. The losses observed in commodity prices were in many instances smoothed by the depreciation of local currencies, which prevented a quicker adjustment. There are two good examples of this: one from the coffee market and one from the oil market.
In the case of coffee, prices declined in 2015 as the harvests in Brazil and Colombia were good. But with the Brazilian real losing value at an accelerated pace, instead of cutting output, coffee producers had an incentive to increase it, as lower US dollar prices were not fully reflected in lower real prices.
The same reasoning applies to the oil market. Russia, for example, has been increasing output to levels not seen since the old USSR, as the steep decline of the rouble provides an incentive for output to be increased.
Currency devaluations work as a stabilisation mechanism for commodity producing countries but prevent an adjustment in supply that is perpetuating the current bear market.
A return to the 1990s?
The commodity slump is the natural consequence of a huge bull market that lasted for years and was artificially boosted by public policy. Now that such policy is reverting, it is very likely that commodity prices need to revert to their 1990s levels – a period where the excesses in terms of monetary policy started gathering pace and when China started driving demand for commodities higher. One way to look at how far we are from those levels is to estimate the average price for commodities during the 1990s, using today’s prices, and check the difference.
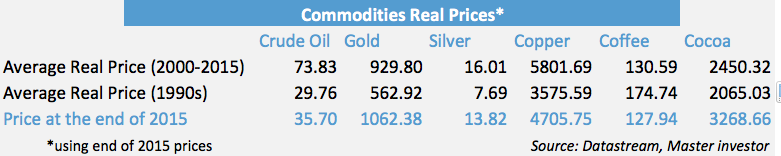
If we use end of 2015 prices to calculate an average price for commodities during the 1990s, we see that there is still room for further declines, as oil and copper (two important commodities benefitting from the quick industrialisation) are still 20% and 31% respectively above their 1990s averages. Gold and silver are almost double their 1990s averages, but these metals also benefit from monetary policy excesses and may be more in line with the quick expansion of the money supply. The case for cocoa is significantly different, as productivity has been decreasing at a very fast pace and supply is ever more limited. Production essentially comes from small crops in the Ivory Coast and Ghana, run by poor farmers as family businesses. These farmers are finding alternative ways to make a living, as they get just a very small share of the international cocoa price. For this reason, and in stark contrast to other markets, cocoa will continue to live with tight supply conditions driven by growing demand.
Some final remarks
The adjustment in supply in the commodities markets is not yet complete, which means further price declines and increases in volatility are to be expected in 2016. The world needs to adapt to a new reality: one where China will no longer lead global growth and where manufacturing is no longer their top priority. Emerging markets, in particular those used to making a living from exporting commodities, will need to reposition their economies. Saudi Arabia will run into difficulties, as they’re no longer in control of oil prices; and while they try to bust everyone by keeping production levels unchanged, they’re going to burn the astonishing amount of reserves they have accumulated so far – $100 billion is already gone. They will start taxing the population and the 30-year peg of the riyal to the dollar may be at stake. At a time when Iran is waiting to offload its 150 billion barrels in reserves, Saudi Arabia will need to be creative to counterbalance the expected losses.
Comments (0)