As goes January, so goes the rest of the year…

There are many sayings in the financial markets regarding calendar effects. Some say “sell in May and go away”; others say “as goes January, so goes the rest of the year”. Both sayings are based on persistent performance anomalies that were uncovered by traders and confirmed by researchers. Today I’m going to test another calendar effect and try to coin the saying “as goes the first ten days, so goes the year…”
Calendar Effects
Back in December I wrote about the January effect, which is a calendar anomaly first reported by Rozeff and Kinney in 1976. They analysed the performance of a portfolio of NYSE equities and found that January returns were on average near 3.5% while the average monthly returns for other months were just around 0.5%. That was an intriguing finding, in particular because it was not a single-year anomaly, but a rather persistent one, reported for a 71-year period (1904-1974). They additionally reported that over one-third of annual returns occurred in January alone. So, while performance was on average still positive for the rest of the year, January performance was on average 7x better.
But when other researchers fine-tuned the portfolio used to measure returns, they found that what Rozeff and Kinney uncovered is in fact a small caps phenomenon. If only large companies were taken into consideration, the January effect would vanish. This inspired Keim who further refined the analysis in 1983. He found that the excess returns small firms usually command are concentrated in January – half of their outperformance comes in that single month. But even more intriguing is the fact that half of these January returns came in the first five trading days. So, putting it all together, an investor can achieve excess returns by investing in small firms during the first five trading days of the year. Or, perhaps he can do even better by following what Reinganum reported in 1983, where he claims that the outperformers are mostly those small firms whose price has declined in the previous year. This contrarian theory was corroborated many times, with “losers” often reverting to “winners”, and with such reversion usually being more pronounced during January.
Why do these January effects happen? Well, many explanations have been advanced: some point to tax effects, while others point to portfolio rebalancing actions. No good explanation has been given so far. To complicate matters even further, several other calendar effects have been added to the seminal work of Rozeff and Kinney: a weekend effect, the Monday effect, the Mark Twain effect, and many others. Many of these effects were temporary and have now vanished, but others are more permanent and are still observable decades after being first reported.
With January being so intriguing in terms of performance, it is one of those months that is worth a further look. Many traders say that this month is a bellwether for the rest of the year and therefore anxiously wait for the month to end in order to check how the rest of the year is going to unfold. They say that on average, a strong January performance is associated with a higher than average performance for the rest of the year.
But others say that we don’t even need to wait until the end of January, as the performance of the first few days of the year may be enough of a bellwether to determine what awaits us in the rest of the year. Judging by Keim’s research (referred to above) such an assertion could make sense, as half of the January action seems to occur during the first five days. Why not check it out?
I don’t have the time to conduct exhaustive research on the topic – and you, as reader, probably wouldn’t have the patience to read it. But we can conduct a simple experiment to check whether the first few days of January serve as guidance for the rest of the year’s performance.
Gathering Some Data
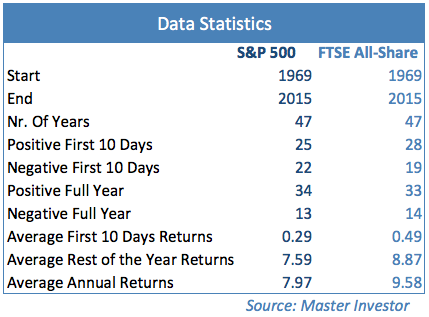
I collected price data for the S&P 500 and the FTSE All-Share indices for the period 1969-2015. The main idea was to analyse annual performance, first-10-days performance, and rest-of-the-year performance. The annual performance is given by the arithmetic price change for the full year. The first-10-days performance is the performance for the first 10 days of the year, as reported by Datastream. I opted for ten days instead of five in order to allow proper time for investors to recover from the holiday season. I didn’t want the entire January month, but I also didn’t want to miss important price action, so I decided that ten was a good number. The rest-of-the-year performance is just the arithmetic price change for the period between the end of the 10th day and the rest of the year. So, let’s say the FTSE is quoted at 3,050 at the end of 2014, then at 3,250 at the end of the first 10 days of 2015 and finally at 3,150 at the end of 2015. In such a case, the first-10-days performance would be +6.56%, the rest-of-the-year performance would be -3.08% and the full year performance +3.28%.
Getting Some Numbers
The main statistics on the data show that the S&P 500 rose 34 out of 47 times (72.3%) while the FTSE All-Share rose 33 (70.2%). These numbers are expected as long as equity performance has a positive bias over long periods. Average performance is of course never zero but some single-digit positive number. In my case it is 7.97% for the S&P 500 and 9.58% for the FTSE All-Share.
Let’s now concentrate on the first ten days of the year. The S&P 500 shows an average performance for that interval of 0.29% while the FTSE shows a performance of 0.49%. Those numbers are quite large if we take into consideration the fact that they represent a share of 3.6% (S&P 500) and 5.2% (FTSE All-Share) on average annual returns while just 0.038% on the number of trading days. This confirms prior claims that a significant part of the yearly action occurs in January, in particular during the first few days.
Ranking the Data
One way of getting an idea on how the first days’ performance may be related to the rest-of-the-year performance is by ranking performance from high to low and then splitting the data into groups. As I have 47 years, I decided to split the data into four groups, with the first 3 having 12 years and the last just 11. The first group incorporates the 12 best years in terms of first-10-days performance, the second group incorporates the following 12, and so on.
The first two groups for the S&P and the FTSE are composed of only positive first-10-days performance, the last group is composed of just negative first-10-days performance and group three shows a split of 1-11 for the S&P and 4-8 for the FTSE between positive-negative. Average first-10-days performance declines from group to group, by construction. For the FTSE All-Share, it declines from an average of 3.76% in group 1 to 1.11% in group 2, then to -0.35% in group 3 and finally -2.82% in group 4. In the S&P 500 case the corresponding figures are 4.44%, 1.45%, -0.96% and -4.14%.
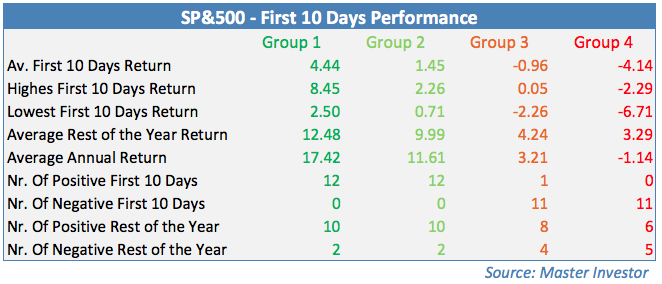
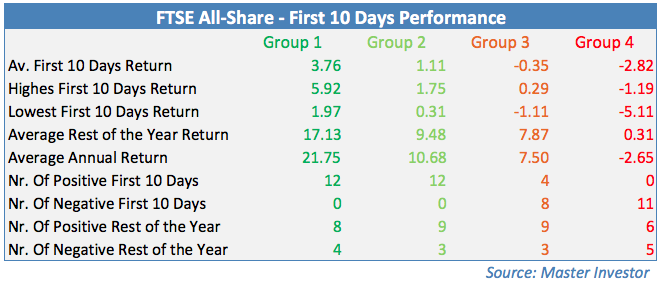
But what happens to the rest-of-the-year performance? That’s the most important part. We want to understand if there is a relationship between the first 10 days of the year and the rest of the year, in particular if the first days are a bellwether for the year. In fact, the average rest-of-the-year performance declines from group 1 to group 4 for both the S&P 500 and the FTSE All-Share.
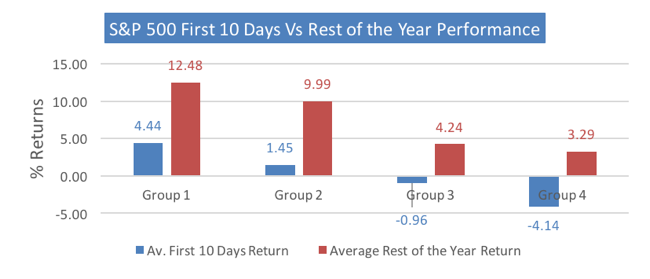
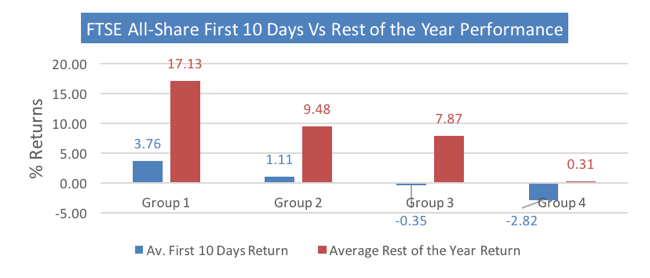
In the case of the FTSE, the rest-of-the-year performance declines from a high of 17.13% in group 1 to 9.48% in group 2, to 7.87% in group 3, and finally to 0.31% in group 4. In the case of the S&P 500 the same numbers are 12.48%, 9.99%, 4.24%, and 3.29%. These data strongly suggest that the higher the first-10-days performance, the higher the rest-of-the-year performance. That being true, the first ten days of the year are a bellwether for the year as a whole. Please note that I’m not saying that if the first-10-days performance is negative, the performance for the rest of the year will also be negative. In fact, that is not the case in any of the groups. Let me recall here that the equities market has a positive drift, as long-term performance is not zero but rather positive. Therefore, when the first-10-days performance is low, the rest-of-the-year performance also tends to be low, even if it is positive.
What About 2016?
We are now at the point where we must ask the question: where does 2016 stand? Unfortunately, it sits right at the bottom of group 4. The first-10-days performance for the S&P 500 and the FTSE All-Share has been -5.97% and -5.27% respectively. Such a performance is the second worse for the S&P placing 2016 right between 1982 (-5.72%) and 2009 (-6.71%), and the worst for the FTSE placing it right below 1981 (-5.11%). In terms of calendar effects, this performance puts both markets in a really uncomfortable position regarding expected rest-of-the-year performance. That doesn’t go to say the market won’t rise, but for those who follow the odds, they’re not looking good.
Comments (0)