Price action or indicators – which is best?

| Master Investor Magazine
Never miss an issue of Master Investor Magazine – sign-up now for free! |

Charts guru David Jones investigates which tools in the chartist’s toolbox are best – price action or indicators?
Chartists are, on the whole, a mild-mannered bunch. But one divisive topic is often guaranteed to raise their hackles. And that is the question of the best approach to technical analysis – is it to focus on the price or look at some mathematical derivation? This month, we will address the question of what is best – price action or indicators. Trust me, it is much more exciting than it sounds.
The different ways of analysing a market
I have been a technical analyst for almost 25 years and in that time, I have seen a shift in the way technical analysis and charting is viewed. Back then, it was seen as a niche and somewhat nerdy approach to looking at markets, with an element of crystal-ball gazing and voodoo thrown in. Today I think it is fair to say that, while it is still not a mainstream approach, it has gained a wider acceptance. I think this is mainly due to the greater number of private investors involved in financial markets – particularly when it comes to shorter-term trading of assets such as foreign exchange, commodities and even cryptocurrencies.
Thanks to the proliferation of higher-speed internet and smartphones over the last decade or so, financial markets have been opened up to a whole new market. This is a good thing. But some people seem to believe that there is a Holy Grail to be found. They view markets like some sort of video game, where if you can just access the ‘cheat’ codes, then you are going to win. I may be over-egging it slightly, but based on the conversations I have had with probably thousands of newer entrants over the past 10 years, plenty of them seem to see it that way.
Which brings us back to the argument of analysis using price action (old-fashioned), versus indicators (new-fangled). Let’s examine these two approaches in more detail.
Price-action analysis
The assumption behind this approach is very simple – price is everything. For example, if XYZ market or share is trading at 500, then 500 is the fair market price, taking into account all factors that are in the public domain. If the market or share has been trending higher over the past few days/weeks/months, then the price-action trader or investor is looking to go with this momentum and the broader market view. The person relying on price action is not trying to guess major turning points where a market may be overbought or oversold (whatever those terms actually mean) but is instead looking for price to lead the way.
Here is an extreme example, but one I have traded/invested in personally over the past few months − the price of the precious metal, palladium.
Palladium price – August 2018 to December 2019

I think the extreme nature of this example highlights a couple of important points. First of all, good trends in markets should be easy to spot. It is pretty clear what the trend in palladium has been since the summer of 2018, and that carried on into December 2019. On the extreme right edge of the chart, the price is again moving out to fresh all-time highs, looking like the trend is about to start its next swing higher.
But from a psychological point of view, how hard is it to buy right now? The price has doubled in the last 18 months, but the price-action trader is meant to just grit their teeth and push the ’buy’ button. This is the very essence of using price – we let the market lead the way. For whatever reason, the price moving to fresh highs shows us that palladium traders and investors are happy to continue to pay higher prices for the metal. As a price-action trader, following the trend is the obvious option here. Let’s jump forwards.
Palladium price October 2019 to present
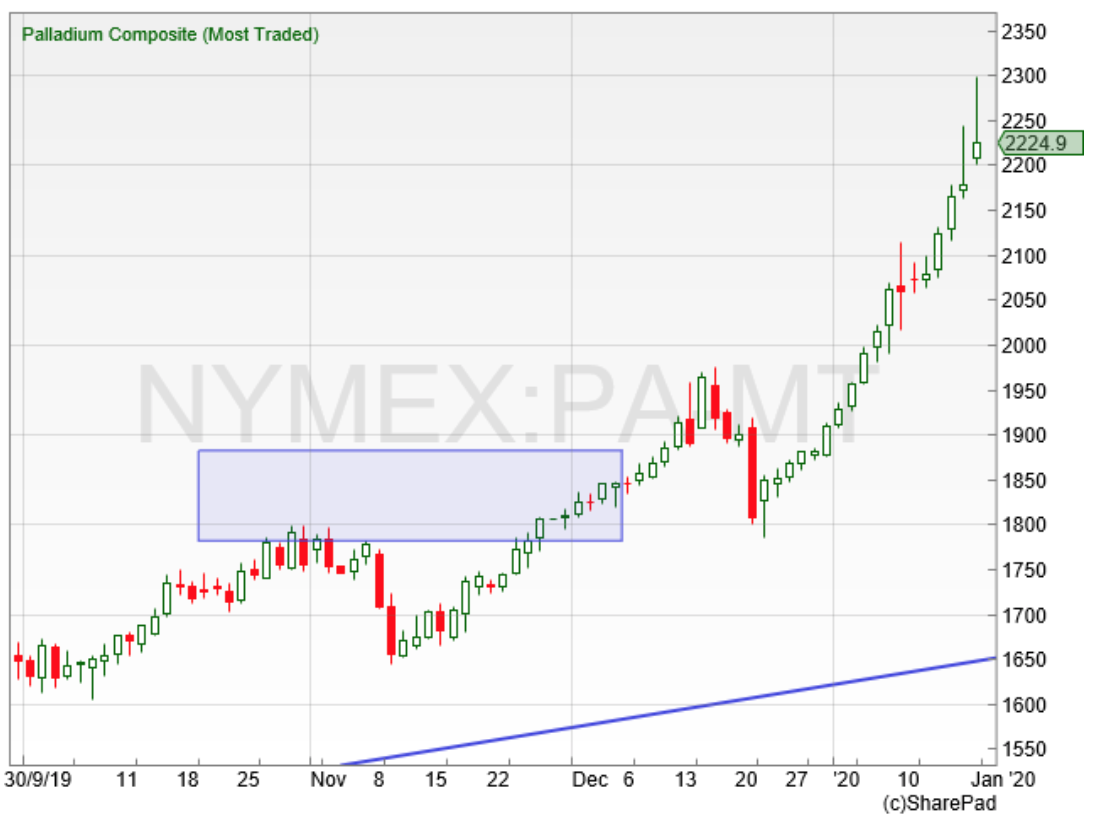
I did say that palladium was an extreme example – and those eye-watering moves have continued into January 2020. It is the same highlighted area on the next chart as in the previous chart. The break upwards in December was the buy signal from a price-action point of view and came in around $1,850 an ounce. So far in January, the price has traded as high as $2,300 an ounce − a rise in excess of 20% in under two months. The price-action trader has been well rewarded in going with the trend.
Bringing it back to markets that may have more of a mass-market appeal, here is the broad US stock- market index, the S&P 500. Let’s take a look at the simple approach of buying new highs. For the novice market observer, the knee-jerk reaction of a price moving to new highs may be that it is too expensive now and cannot go any higher. But from a price-action point of view, it shows that investors and traders are happy to pay higher prices than before – otherwise it would not be going up – it can therefore be a suggestion that a new norm is being set for this market. So, following price action, the simple approach is to be a buyer of new highs.
S&P 500 Index, December 2018 to present
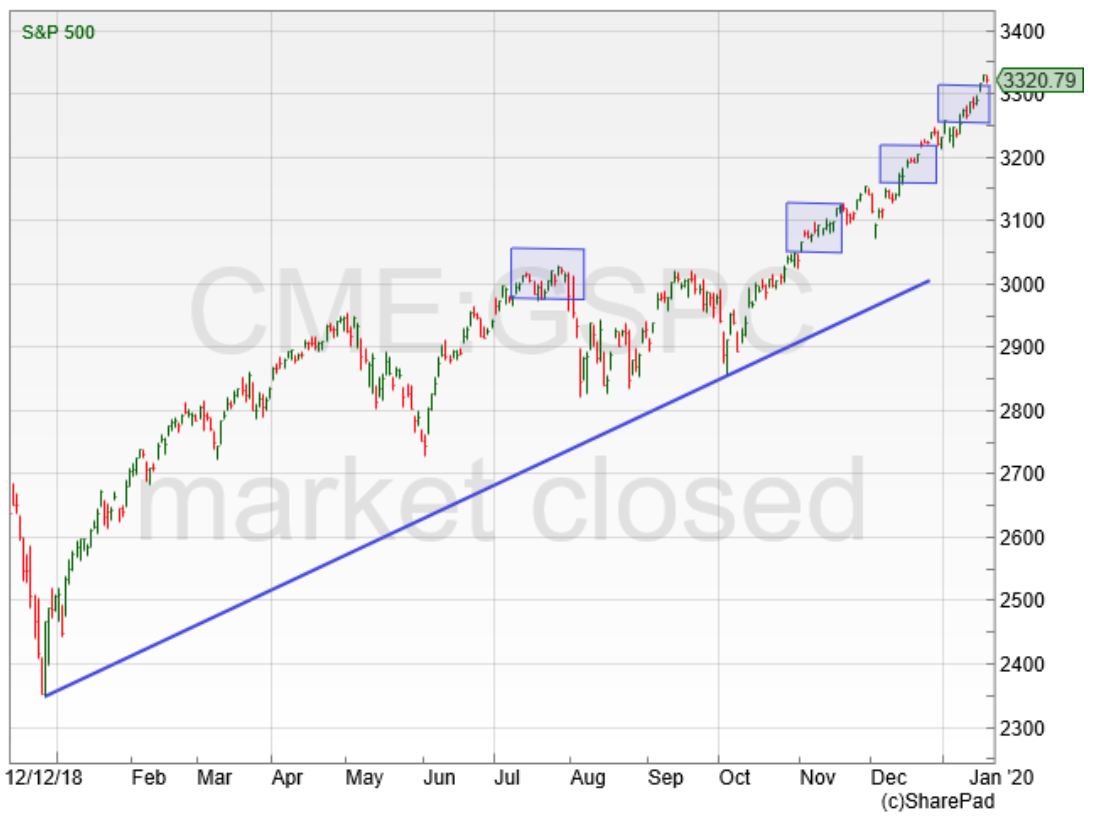
At the time of writing, with the S&P 500 having set yet another new all-time high in the past few days, this approach obviously would have been profitable. As ever, it is where you get out that dictates the final profit or loss. But as a starting point, using the very simple approach of buying new highs, the investor or trader is at least putting momentum on their side.
Indicators/oscillator analysis
It easy to see the appeal of using indicators and oscillators for market analysis – and one that particularly appeals to shorter-term traders. Just to show what I mean when talking about oscillators, we have a chart of the FTSE100 index with a 10-day relative strength index (RSI) at the bottom.
FTSE 100 Index – April 2018 to present
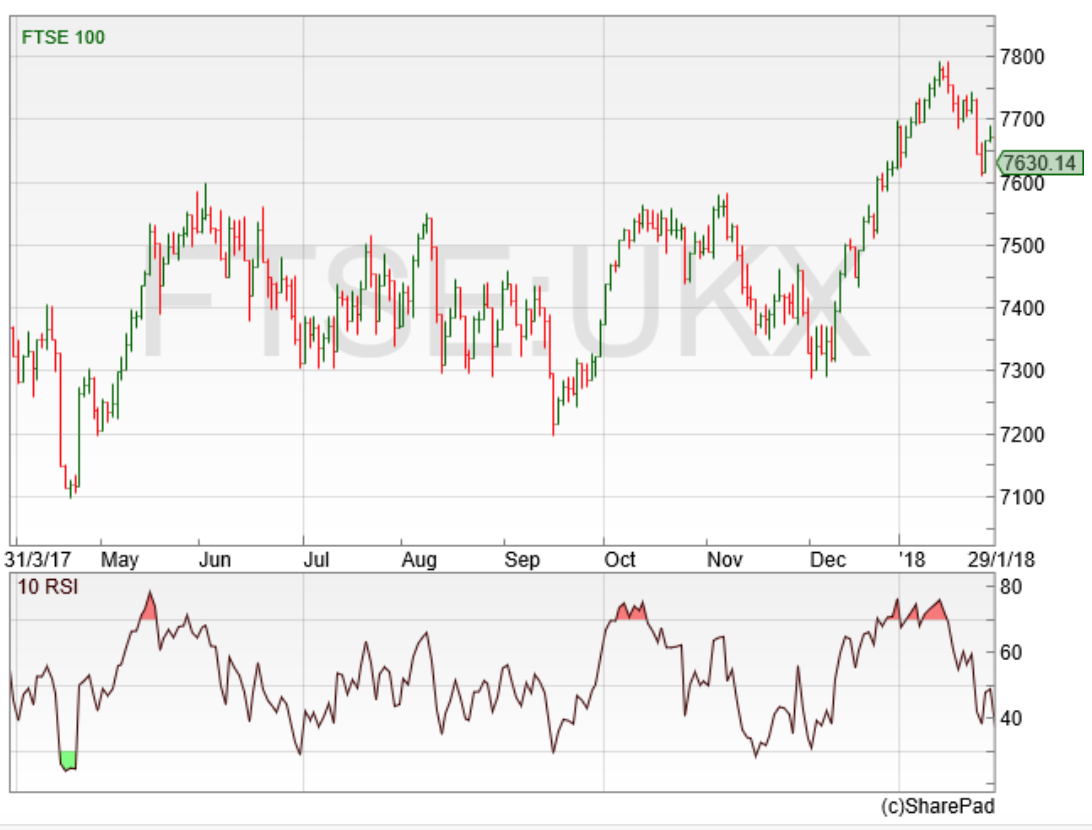
The RSI is a classic overbought/oversold indicator. In a nutshell, this 10-day version looks at the momentum of the FTSE over the previous 10 trading days. It measures the magnitude of daily price swings and, applying a mathematical formula, represents whether this could be an overbought or oversold move in the market. Traditionally, if the RSI has a reading above 70%, the market is thought to be overbought and is due a slide. There are three overbought areas on the FTSE100 chart, where the RSI is shaded at the peaks. An RSI reading below 30% suggests the market is oversold and is due a bounce. There is only one oversold signal on the FTSE100 chart, on the left-hand side at the lower extreme.
It is easy to see the appeal of having a magic formula to figure out the market for you. And in fairness, the 10-day RSI on the FTSE100 chart has not done a bad job of calling short-term turning points for the index. Indicators such as the RSI do perform better in sideways trending markets – which is what the FTSE was doing for most of the period shown above. Where they fall over is when a market starts trending – let’s return to the palladium chart.
Palladium – February 2019 to present
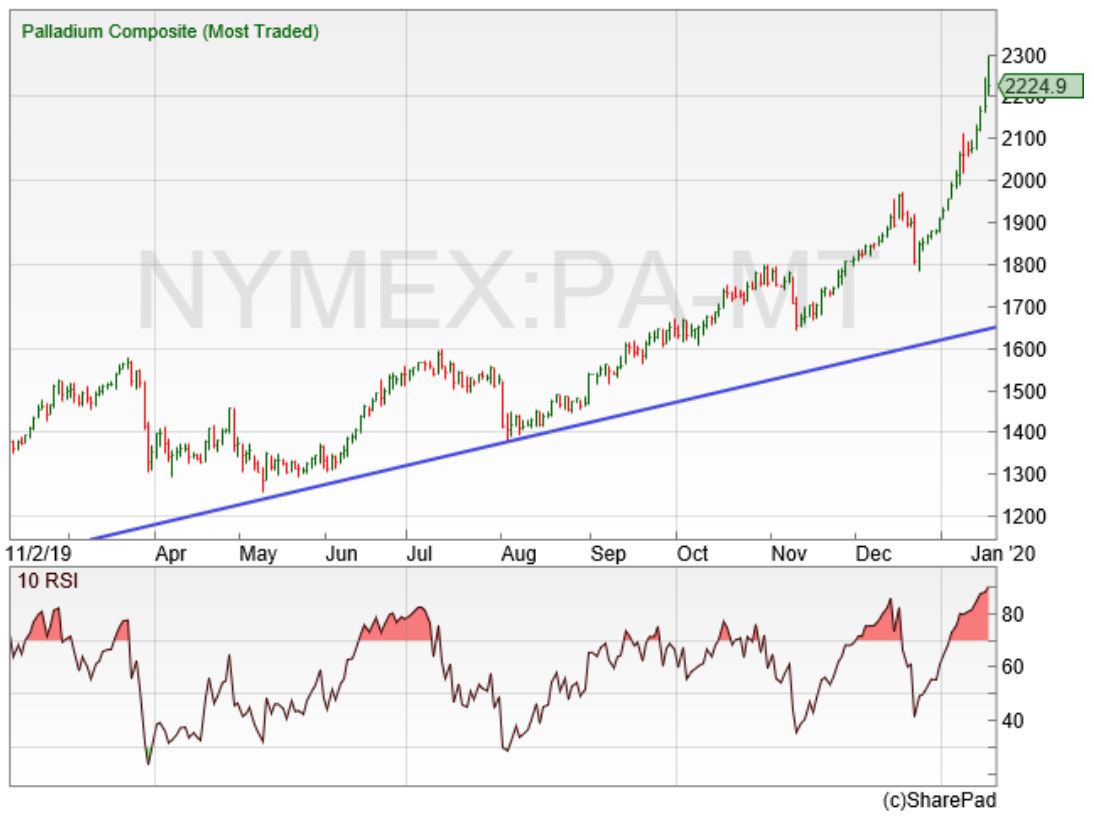
Back to our extreme example – but it is a great illustration of the problems with the many overbought/oversold indicators that can be applied to charts. With palladium, there was only one RSI buy signal in an 11-month period, just before April. The rest of the time, the RSI was positively discouraging an investor to buy into strength. As palladium pushed higher the RSI went overbought – but the price did not care, and the trend pushed on.
In my opinion, this is the major drawback of ignoring price. Indicators such as the RSI, MACD (moving average convergence-divergence) indicator, stochastics and so on, definitely have their place as part of the toolkit in figuring out where a market may move next. But it is far too much of a temptation for those new to charting and technical analysis to place excessive emphasis on the predictive abilities of these tools. This means that they can end up not looking at what the price is actually doing – and as a result miss out on major moves such as those in markets such as the S&P 500. Never underestimate the power of just listening to what the market in question – whatever that is – is trying to tell you.
Comments (0)