Vive La Résistance! Et Le Support

I saw a sign for ‘recycling’ in my local supermarket. I followed it and all I found was a lot of bikes that you were permitted to ride to places you’d already been before.
One of the most powerful aspects of TA is price charts going back where they’ve been before. Support and Resistance are key levels in a share price action. They’re often levels that, for whatever reason, have become emotive for investors and other market participants because there was high activity and volume. In fact the Bloomberg Terminal has a rather helpful horizontal zener type indicator that pushes across showing volume AT the price it occurred at, as opposed to the bar or candle. Price not date/time. It’s helpful because it shows the support and resistance levels very clearly and in an intuitive and helpful way. Of course most of us don’t have a Bloomberg terminal, myself included.
These S/R levels are important and tend to be flash-points precisely because they are prices where decisions have to be made. They are where profit turns to loss, or stop losses get hit, or profits get taken. This is why you’ll often see them hit several times before breaking out or giving up. They are causing a response each time they hit, and obviously there’s a limit to how long that can be the same response, at which point they will either push through the S/R or fail at it.
A lot of traders use Fibonacci retracement overlays to predict S/R. In some ways it’s now hard to know if they succeed because so many use them, or because they actually work, but if they work simply because the world and his wife expects them to then we need to be at least aware of them.
I generally find that things people use simply because they’re there, are more often associated with failures of price rather than successes. Again the cause and effect here may be a little elusive. Is it because most people lose? Is it because the markets are mercilessly manipulated by larger players? Well, we’ve always got those problems. One thing that can be demonstrated is that pattern failures are usually more common that pattern successes, and they can be specular. That could well be a sign of failed manipulation. We can’t know that without information that isn’t available to us.
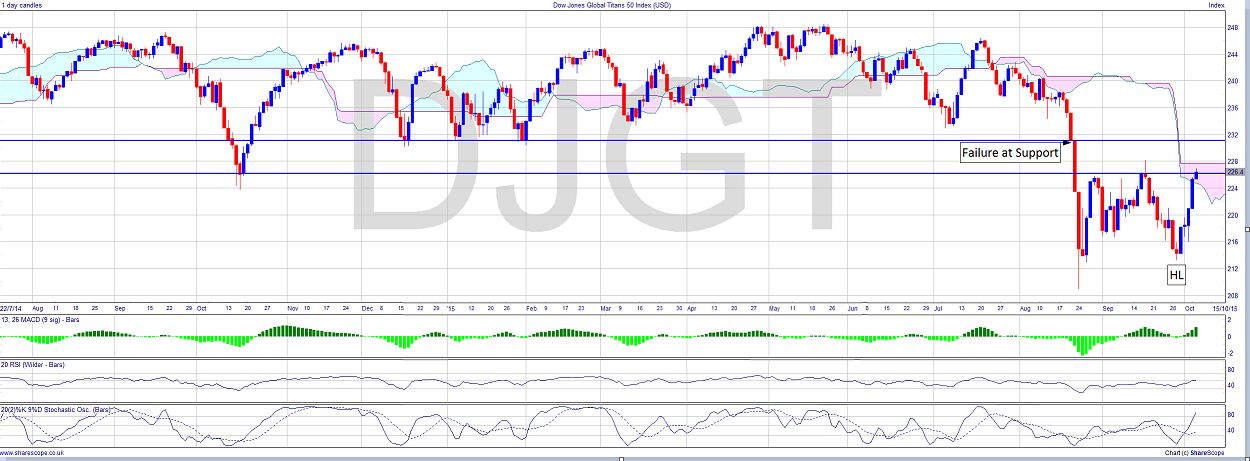
The Dow Jones Global Titans 50 Index [DJGT] is poised at a flashpoint now. It failed at the support level around 230 quite spectacularly. It fraternised with it last winter several times. Now it’s made a Higher Low, and it’s in the cloud so we’d expect it to cross it. We can, in TA, if we see a case for it, ignore the tails of candles. It does depend a bit, but a long tail can be the result of a single trade in some cases, or a flurry of activity not supported by volume and market conviction. So it will be interesting to see how this one plays out. If it simply goes sideways without breaking above the cloud it will fall out the bottom of it in a few weeks. Then we’re bearish. Just now we’re ambiguous. Another Higher Low might be a buying signal, but we need more signals to be able to commit.
Comments (0)