One mans bullish take on gold & silver using COT analysis
The cyclical ebbs and flows of Comex open interest in gold and silver futures trading is a somewhat arcane topic that receives very little blog commentary and, with a couple exceptions out of London, zero mainstream media attention and Wall Street analysis. But, if you follow what has become a pattern endemic to the Comex precious metals open interest data, you can gain an information and trading edge on the rest of the market.
Last Monday, after looking at the increase in open interest on the Comex, I opined to some colleagues that I believed that the increase in open interest over the past week was a product of large hedge funds chasing the momentum and chart technicals of the gold market lower. I suggested that we would know if my theory was correct when the Friday Commitment of Traders Report (COT) was released. For those who don’t know, the cut-off date for this report is the prior Tuesday. The CME reported a large increase in the gold futures open interest for both the previous Friday and the Tuesday COT cut-off day.
As it turned out, the increase in the weekly hedge fund short position is the largest weekly increase since May last year and the large hedge fund gross short position in Comex gold – 10.1 million ozs/293 tonnes – is the largest hedge fund short position in gold dating back to May 2005. The Got Gold Report posts an excellent COT table which shows breakdown in the various COT trader categories (Commercial/big bank, large spec, small spec): Weekly COT report. Here’s the link to the Got Gold Report Blog: GGR
Why do we care about this? To review, the COT report is segregated basically into the Commercial Traders, which include users/producers of gold/silver and Wall Street dealers; the large speculators, which are the hedge funds; and the small speculators, which are the retail account traders. Historically, the trading pattern is that the large specs continually increase their net long position in gold/silver when the market is moving higher. Since futures are a zero sum game, for every buyer there has to be a seller. Accordingly, the big Wall Street banks take the other side of the large spec net long position.
When the large spec gross long position runs up to a relatively high level, it’s usually a signal that the market is getting ready to correct. As such, we will observe an inordinately high level in the Commercial category short position. This typically starts a period of cliff-dive type down days, as the hedge funds all seem to rush for the exits at once and the Wall Street dealers use that selling to cover their short position. It’s a wash/rinse/repeat cycle.
In the last few years, a new pattern has emerged toward the end of particularly vicious price correction cycles. The large hedge funds, after liquidating a significant amount of long positions, start to “chase” the downward momentum of the market and pile into the short side. Concomitantly, we will observe the commercials/banks cover their short position – taking it to a relatively low level – and start to actually get long the market (or less net short, as it were).
After 12 years of studying the Comex open interest and COT patterns, I’ve gotten pretty good at “sniffing out” when market is behaving like the hedge funds are piling into the short side. As you can see from the chart below, this pattern also is a very good indicator that a price correction cycle is ending (i.e. gold/silver prices are bottoming out):
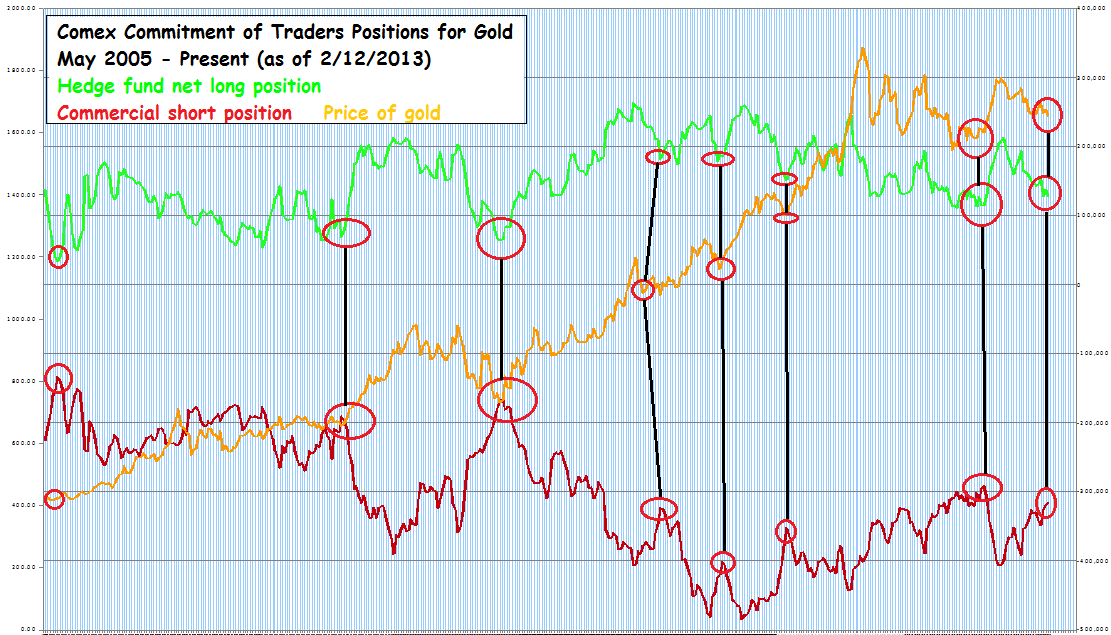
My fund partner has been keeping track of the weekly open interest and COT report positions since early 2005. This chart shows the weekly hedge fund net long open interest vs. the commercial trader gross short position. It dates back to May 2005 and runs through Friday’s COT report. You can see from the aligned red circles that the gold price hits a “cyclical” bottom after a period in which the large hedge fund net long position hits a low point and the commercial gross short position also hits a “high” point (the short position is negative, so a high point on that data series represents a low short position).
Using this information, it appears to me that the current sell-off in gold/silver is at or near an end. If the cycle repeats – and I have no reason to believe it won’t – traders and investors can take advantage of this set-up by either adding to existing gold/silver positions for putting on aggressive trading positions. Here’s how the London precious metals unit of UBS characterizes the current COT set-up:
“The sharp extension in gold short positioning increases the likelihood of a short-covering rally in the near-term, particularly if physical buyers step up to the plate this week and/or strong buying interest during the London fixing continues.”
(Note: that excerpt comes from a proprietary report and I thus cannot link it). Interestingly, last night in overnight trading, the India/Asian physical bullion markets were aggressively buying. In fact, on the Shanghai exchange, the delivery volume was 7.76 tonnes and the open interest in Shanghai jumped 24.978 tonnes, both of which reflect an aggressively bullish stance on gold. If this physical buying trend continues, we’ll see the hedge funds on the Comex quickly cover their paper short positions.
From SeekingAlpha. Link – http://seekingalpha.com/article/1201471-physical-vs-paper-is-the-gold-silver-price-correction-over?source=google_news
Comments (0)