Piling Into a Curve Steepener Trade

The Federal Reserve pushed its key rate from 0.00% to 5.00%, over nine consecutive increases in little more than a year. Although current inflation levels are high, long-term inflation expectations remain steady at around 2%, causing the yield curve to invert to levels not seen in decades. However, growth prospects are dim and investors are betting on rate cuts starting next year. The inflation rate is still way above target, but as time elapses, the monetary contraction will play its role. I believe we’re nearing the terminal rate level for monetary normalisation. After that, the yield curve will regain its most common upward sloping shape. An interesting opportunity is arising in the form of a rate steepener trade.
Many still believe the US economy is not heading towards recession. However, such an outcome would be different from what happened all other times, once we entered a period of an inverted yield curve. There are only two ways for the yield curve to regain its normal shape. First, if growth and inflation begin picking up, such that investors review their long-term expectations for interest rates. Second, if the central bank begins cutting interest rates, therefore causing short-term rates to go down. The route has always been through the second alternative and there’s no reason to believe this time will be different. At fighting inflation, the Fed is negatively impacting credit markets, therefore contributing to reduce overall economic activity in the future. Since the short-term interest rate is already high, it’s possible that we’re close to the end of the current tightening cycle and at the peak of the yield curve inversion. All we need is to translate the yield steepening into a tradable asset.
The Shape Of The Yield Curve
The yield curve is a plot of the bond yields (interest rates) for different maturities and the same risk, liquidity and tax considerations. Often, it’s a plot of Treasury yields. It reflects the term structure of interest rates. Usually, the curve slopes upwards because investors demand a higher return to account for the risk of fluctuating interest rates when investing in longer-term securities. Thus, even if expectations about future short-term interest rates were flat, the curve would slope upwardly.
At the short-end, the yield curve is determined by expectations about monetary policy action. If investors expect the Federal Reserve to raise interest rates, the curve increases at this end; if investors expect rate cuts, the curve falls. The long-end of the yield curve is affected by various factors such as economic growth, inflation, and demand for long-term securities.
As the Fed has been hiking its key rate to fight inflation, the yield curve has been inverting. Investors view the current economic prospects as unpromising, which has resulted in an extreme inversion. This suggests they find the current monetary policy too tight for current and expected conditions.
One way of measuring how flat (or steep) a curve is, is through the spread between a long-term yield and a short-term yield. The most common spreads are the 10-year minus 2-year Treasury and the 10-year minus 3-month Treasury, plotted below. The chart also shows the behaviour of the banking sector, represented by the SPDR S&P Bank ETF (NYSEARCA:KBE)
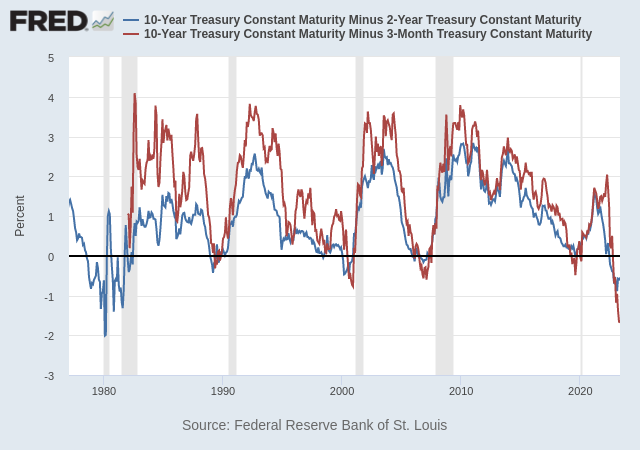
The current spread between the 10-year and the 2-year yields is -55 bps. It was as low as -107 bps last March in the advent of the Silicon Valley Bank crisis. These levels were last seen in 1981, more than four decades ago, when a deep recession followed. The spread between the 10-year and the 3-month yields is even deeper, currently at -168 bps. These figures reflect the view that the current monetary conditions are too tight and that they will soon be reverted. If there was a time to expect a steepening of the yield curve, it is now. When that happens investors should worry with their investments because, more than the inversion itself, the steepening of the curve is associated with a recession.
How to profit from yield steepening?
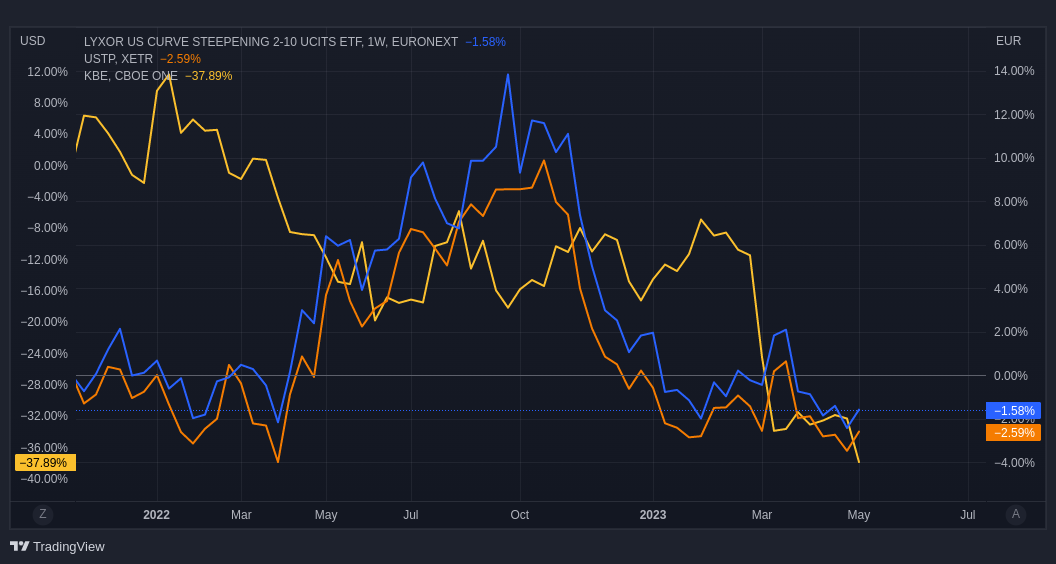
The idea behind a curve steepener strategy is to profit from rising long-term yields relative to short-term yields. From a pricing perspective, it is about rising short-term prices relative to long-term prices. Thus, an investor would be seeking a long exposure to short-term Treasuries and a short exposure to long-term Treasuries. Originally, investors seeking this kind of exposure traded a spread of futures contracts. However, that’s a tough route because it’s difficult to find the proper long/short ratio for the two-legged trade. Investors would need to periodically readjust their trade to account for the impact of fluctuating prices on the ratio. In the world of ETFs, investors can purchase the iShares 1-3 Year Treasury Bond ETF (NASDAQ: SHY) to aim for the short-end of the yield curve and sell the iShares 10-20 Year Treasury Bond ETF (NYSEARCA:TLH) to target the long-end. However, such trade wouldn’t overcome the need to adjust the long/short ratio. Additionally, it could create a new problem, of requiring a much larger amount of funds in comparison to futures trading. For these reasons, it may be easier to set the strategy using a single ETF. Currently, there are two good options for European investors, both created in 2019, eventually in anticipation of the current scenario.
Lyxor US Curve Steepening 2-10 (STPU)
Lyxor’s STPU was launched in 2019 and is Europe’s first US Treasury steepener ETF. The fund follows the Solactive USD Daily (x7) Steepener 2-10 Index strategy, using a leveraged long position in 2-year US Treasuries and a leveraged short position in 10-year US Treasury ultra bond futures. This strategy is leveraged seven times, but since it involves bonds and a long/short approach, the risk level remains low. The total expense ratio for this ETF is 0.30%, and it can be bought in several European markets.
Ossiam US Steepener (USTP)
Ossiam’s USTP tracks the Solactive US Treasury Yield Curve Steepener 2-5 vs 10-30 index. The strategy is similar to Lyxor’s ETF with a few differences. USTP’s leverage multiplier is higher, amplifying positions 10 times instead of seven. Additionally, its holdings are spread over multiple maturities. The long position covers two-year and five-year notes, while the short position includes 10-year Treasuries and longer-dated bonds.
For a more concentrated bet, investors may be better choosing Lyxor’s STPU. For a more balanced bet on the steepening of the yield curve, which also targets longer-term bonds, Ossiam’s USTP is the way to go.
A Few Final Words
With interest rates on a sharp rise and US stocks recording significant gains over the last decade, now may not be the ideal time to invest heavily in stocks. At the same time, with inflation still rising above the central bank’s goal, bonds don’t offer great real returns. However, there’s potential for a few side bets like the curve steepener presented above. The current yield spread is at a 40-year low and will soon reverse as central banks approach their target interest rate for the current tightening cycle. This is where the curve steepener trade may shine.
Very interesting article.
Unfortunately, short term us Congress is mucking around with not extending its debt ceiling. In four weeks us can run out of monies to pay its bills.
Maybe they will claw their way out of this hole, just in time. But as usual both sides are posturing, and the numbers are pretty evenly balanced.
Should the us default, nobody knows what would happen. It would be like falling into a black hole.
Heads down, batten hatches … At least for a month …