Investment Companies Vs OEICs: The Asian Total Return Fund

The AIC has recently published some interesting research that compares the risk and performance of investment companies and open-ended funds. It shows that the former tend to be more volatile because of gearing − they can borrow to increase the amount of money they have to invest − and the fact that the shares can trade at a premium or discount to the underlying net asset value (NAV).
One of the most intriguing elements of the analysis was a comparison of 33 ‘sister funds’ conducted by Canaccord Genuity. This is where a manager runs both an investment company and an open-ended fund with a similar mandate. The data offers the most direct form of comparison and shows that although the investment companies have been the more volatile, they have also delivered significant outperformance in all but four of the examples that they looked at.
One pairing that they didn’t consider was the Asian Total Return Investment Company that trades under the ticker ATR and the Schroder ISF Asian Total Return open-ended equivalent. Both of these funds are managed by Robin Parbrook and King Fuei Lee and are run on similar lines.
ATR aims to achieve a high rate of return, primarily through investment in equity and equity-related securities in Asia Pacific companies (excluding Japan), whilst offering a degree of capital preservation through the tactical use of derivatives. It is a virtually identical mandate to the Schroder ISF Asian Total Return fund.
The open-ended fund was launched in November 2007 and at the end of January had $1.9bn in assets under management. ATR dates back to 1987, but has only been managed by Parbrook and Lee since March 2013, having previously been run by Henderson Global Investors. It is much smaller with net assets of £151.7m.
As you would expect, the managers have put together two very similar portfolios. The open-ended fund has 55 holdings whereas the investment company has 62. The 10 largest positions account for 32.4% and 29.4% of the allocations respectively with seven of these businesses appearing in both listings.
The geographic allocation is also virtually the same with the biggest country weightings being Hong Kong, Taiwan, China and India. It is a similar picture with the sector analysis, with the main exposures including Financials, Information Technology and Consumer Discretionary.
Parbrook and Lee have added considerable value by hedging a large part of the market risk of both portfolios. They have recently been using a short position in the HSCEI China index, which is heavily weighted in favour of Chinese financials, rather than index put options that have become expensive as a result of the extreme volatility.
At the end of January the net exposure to the markets after adjusting for the hedge was 81.2% in the open-ended fund and 89.9% in the investment trust. The costs are also different with the former having ongoing charges of 1.93% compared to the latter’s 0.7%.
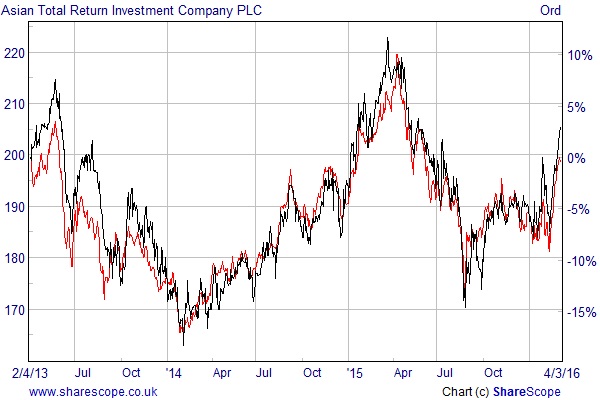
Since Parbrook and Lee took over the investment trust the performance of the two funds has been virtually identical. According to data from FE Trustnet, the open-ended format has lost 2.7% over the last 12 months compared to a sector average loss of 14.1%. The investment company is down 1.1% over the same period, whereas the rest of the sector has declined by an average of 9.4%.
The key difference if you were thinking of investing is that the investment trust shares trade on a 7.75% discount to the underlying NAV. It is likely that this will narrow when market conditions improve, especially as the Board have reaffirmed their commitment to keeping the discount to no more than 5% over the long-term.
Comments (0)