DIY − Building a Portfolio of ‘Cash Cows’

Tech investors are struggling at the moment, as the Nasdaq lost 30% during the first half of the year. They are not alone: the broader market, measured by the S&P 500, is also down by 20%. Not even the Dow has been able to escape the downturn – it has also dropped by 15%. However, in the midst of this storm, there are clear performance differences between these indexes, in favour of the well-established companies in the Dow.
After two decades of underperformance, we are seeing the return of value as an investment strategy. Buying conservatively valued companies seems a better play than buying promises of elevated future profits. However, there are different ways of measuring value, and ratios involving free cash flows appear to capture it better than the most common price ratios including profits, turnover and net asset value.
In my last blog, I wrote about the use of free cash flows as a value metric, but with a focus on ETFs. Pacer Financial offers some excellent options, including the Pacer US Cash Cows 100 ETF (NYSE:COWZ) and the Pacer Global Cash Cows Dividend ETF (NYSE:GCOW). My focus here is on developing our own strategy based on free cash flows. This gives us more freedom and enables us to adapt the strategy to our own needs.
Why free cash flows?
As I explained in my last blog, just because a company is selling, this doesn’t mean it’s making money. Between the moment a sale is recorded in the profit statement and the cash payment for that sale is received, much can happen. Therefore, looking for companies trading on a low price to turnover or low price to earnings may not be enough, particularly during times of financial trouble. We’re changing the focus from profits to cash. Even from the perspective of a dividend investor, it may be worth looking at cash instead of profits as dividends are not paid with profits but with cash.
Free cash flow to the firm is the amount of cash left over after a company has paid taxes and made purchases of fixed assets (capex). However, this cash is not yet fully available to shareholders, because the company must first pay for interest and preferred dividends.
Only after these payments have been made do we get to the free cash flow to equity holders. The larger this number, the better for investors, as this is the amount of money available for the company to invest in new growth opportunities, repurchase shares and pay dividends. Free cash flow is an excellent measure of profitability. When interest rates are rising, companies with excess cash flows don’t suffer the burden of larger interest payments and are then less likely to cut dividends or miss investment opportunities.
With the above in mind, one excellent way of selecting a portfolio of quality value shares is by means of using a free-cash-flow ratio like the free-cash-flow yield. The free-cash-flow yield is the ratio of free cash flow to enterprise value. I use the free cash flow to shareholders here, even though this metric penalises companies with more debt. For our goal of capturing quality companies at times of rising costs and potential recession, I believe this metric is better. Therefore, the free cash flow is the operating cash flow minus taxes, interest and capex. Enterprise value is the market capitalisation plus net borrowing, preference shares and minority equity.
Setting up a quantitative strategy
Following a similar strategy to that used by Pacer ETFs, I start by selecting a market. It could be the S&P 500, the FTSE 100, the Euronext 100 or whatever you prefer. I will apply the strategy to the FTSE 350 and to a large selection of European shares. The strategy is very simple. It involves ranking the companies in our list according to the trailing 12-month free-cash-flow yield. The next step involves selecting seven shares from the top of the list. The exact number can be tweaked as desired.
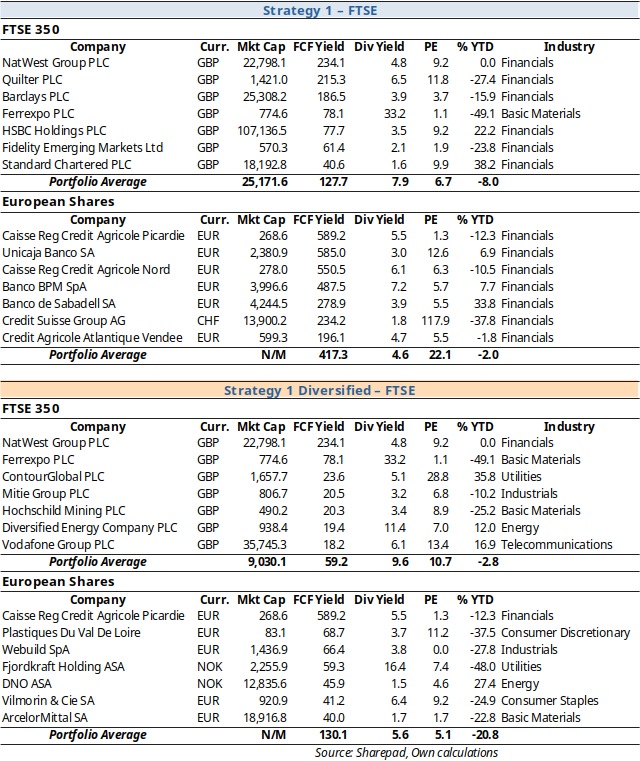
Almost all selections in both portfolios for FTSE 350 and European shares are in the financials sector. These companies trade on very good free-cash-flow yields and may benefit from interest-rate rises. To achieve better diversification, I impose an additional filter on the final list, limiting it to one spot per industry. The non-diversified strategy shows a free cash-flow yield of 127.7 for our FTSE selection and 417.3 for the European one. The average performance so far this year has been -8% for the FTSE shares and -2% for the European shares. The diversified portfolio has slightly worse free-cash-flow ratios and performance but gets us much-needed diversification across industries.
As an alternative strategy, in line with the GCOW ETF, I added an extra step to the above strategy, starting by ranking the companies by dividend yield to select only the top ones. I selected the top 25% of the list. The idea is to select a decent number of shares that trade on better-than-average dividend yield. The next steps are similar to the first strategy and the final selection is made on the ranking by the trailing 12-month cash-flow yield.
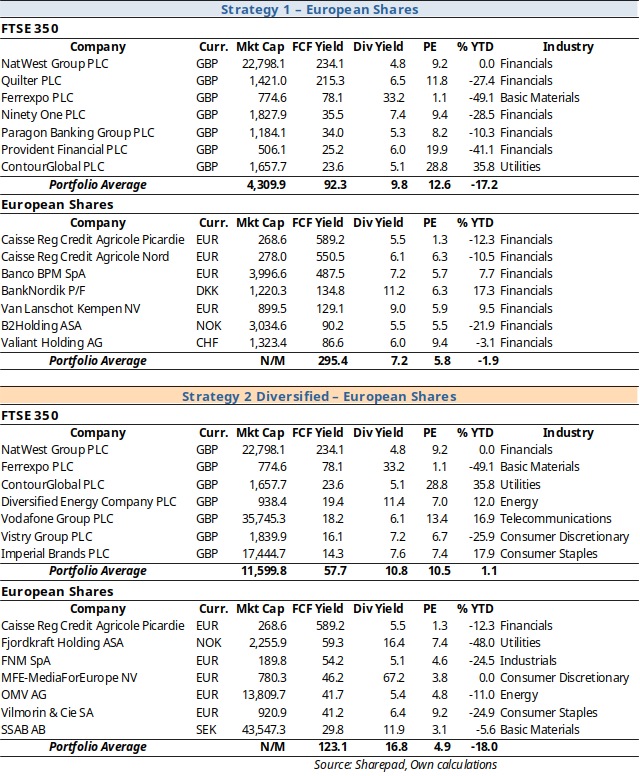
Again, opting for imposing restrictions on industry holdings may be desirable as, otherwise, we would end up with a portfolio of financials stocks.
Final notes
Setting up a quantitative strategy to select shares is neither too difficult nor costly. Investors can start by choosing a few financial ratios that allow them to capture quality, cheapness and general financial soundness, and then find a way of ranking the list to select the top spots. Such a strategy would certainly not guarantee any profits but it would be expected to, on average, beat the market. The case for free cash flows is a good one, in particular at times of rising interest rates and potential trouble.
Comments (0)