Technology trumps consumer staples in the hunt for quality

In a period of change, the franchise/growth framework can help to identify attractive investments. They are increasingly found in the IT sector, writes Andrew Latto.
Quality investing is in vogue. The main focus of quality investors is on financial-return ratios and sector performance. But we have recently seen a reversal of fortune for both the IT and consumer-staples sectors.
The consumer-staples sector was the strongest US market performer from 1968 to 2009, with a 13.57% annualised return. The consumer-staple giants are now challenged by new competition, changing tastes and online distribution.
The IT sector was the weakest US market performer from 1968 to 2009, with a 7.29% annualised return. The technology giants of today, though, benefit from strong and resilient business franchises.
Evaluating the past is generally a prudent and diligent approach. But the forty-two-year period to 2009 has proven to be a poor guide. This article sets out an alternative approach; the franchise power/growth framework.
Sector performance 1968-2009 (annualised)
| Sector | Return | Standard deviation |
| Consumer staples | 13.57% | 15.76% |
| Financials | 12.37% | 17.74% |
| Telecom | 11.86% | 21.44% |
| Materials | 11.59% | 20.83% |
| Energy | 11.57% | 25.48% |
| Utilities | 11.25% | 13.69% |
| Healthcare | 10.55% | 23.16% |
| Industrials | 9.82% | 20.55% |
| Consumer discretionary | 9.6% | 21.97% |
| Information technology | 7.29% | 31.14% |
Source: What Works on Wall Street (2012), J.P. O’Shaughnessy, (P545).
Technology-sector turnaround
“For the loser now, will be later to win. For the times they are a-changin’”
– Bob Dylan, 1963.
In 2011, Andreessen Horowitz wrote the article “Why Software Is Eating the World.” He stated that: “We believe that many of the prominent new Internet companies are building real, high-growth, high-margin, highly defensible businesses.”
Technology has traditionally been viewed as a volatile area, with winners hard to predict and long-term success stories few and far between. But the leading US technology stocks have held onto their market positions since 2010.
The nature of the IT sector appears to have fundamentally changed for the better. Powerful growth drivers have enabled technology stocks to deliver significant shareholder value.
The IT sector is now the largest in the S&P 500 index with a 23.6% weighting. The two largest S&P 500 companies, Apple (NASDAQ:AAPL) and Microsoft (NASDAQ:MSFT), are both technology stocks.
S&P 500 IT sector and S&P 500 (£ ETFs)
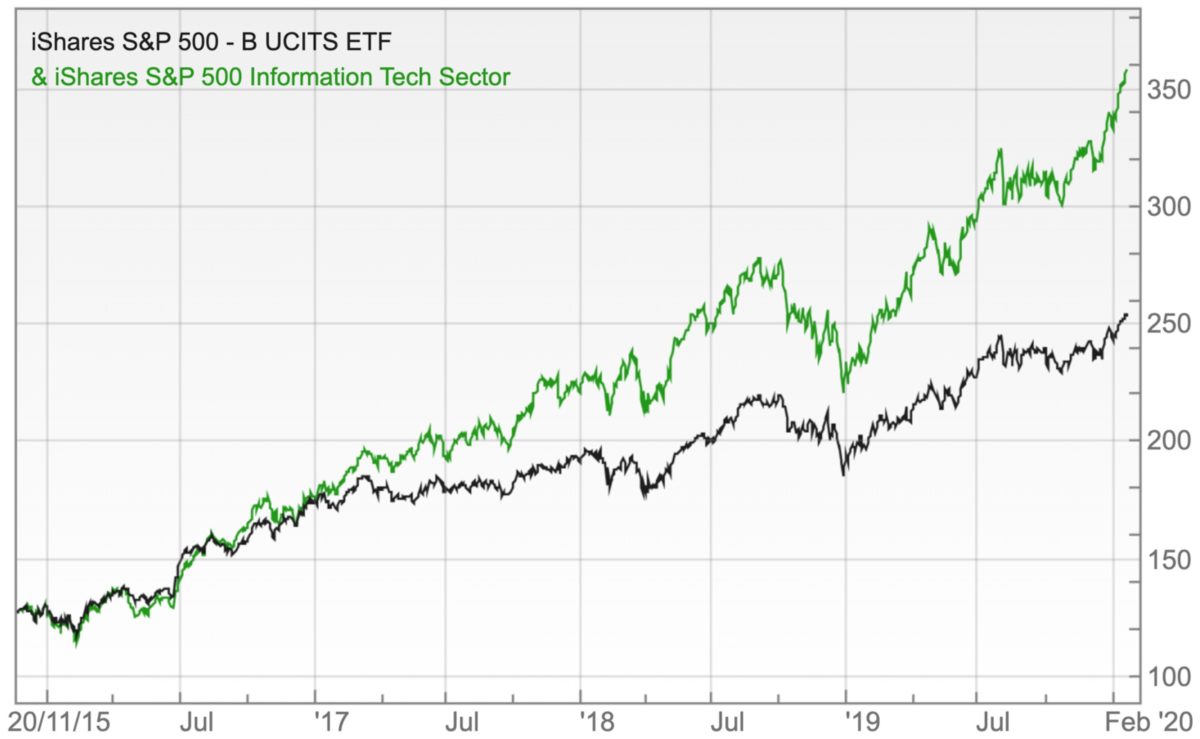
Source: SharePad
S&P 500 consumer-staples sector underperforms (£ ETFs)
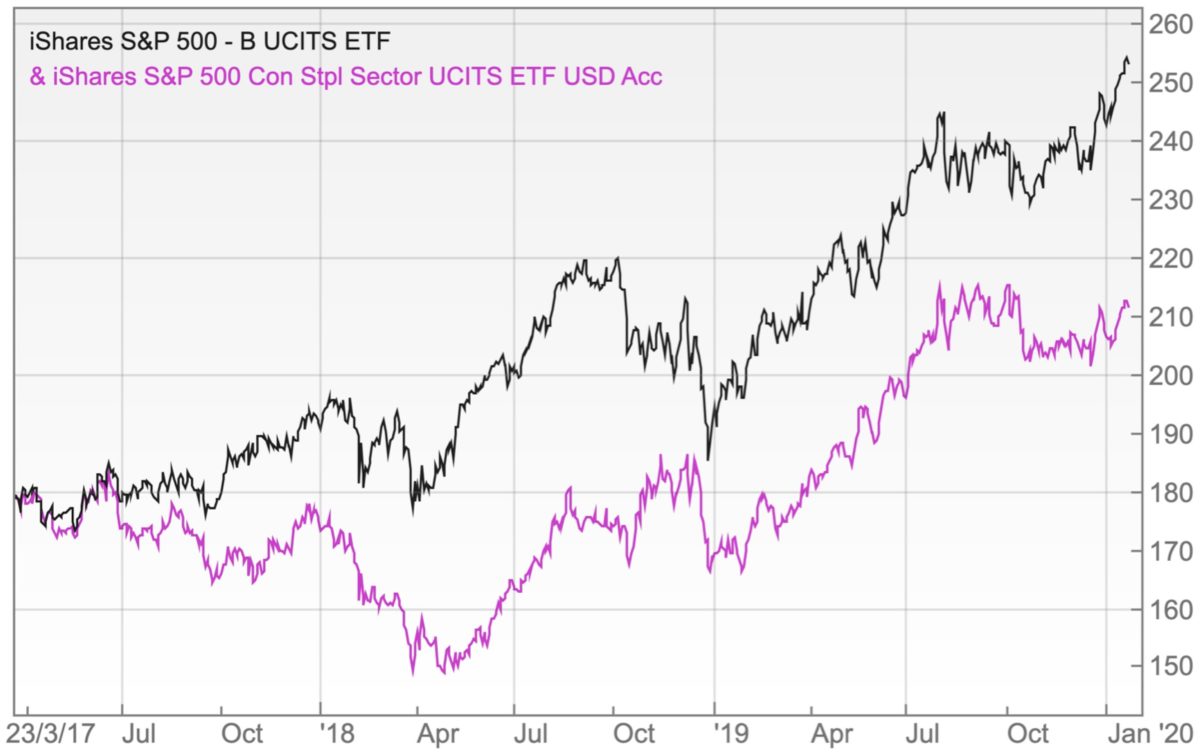
Source: SharePad
Consumer staples under pressure
The consumer-staples sector is generally viewed as a safe and steady performer. It generated the second-lowest sector standard deviation from 1968 to 2009 – a measure that some investors use as a proxy for risk.
But the largest US consumer-staples group, Procter & Gamble (NYSE:PG), has trailed the S&P 500 since 2009. P&G’s market-leading shaving brand, Gillette, has lost market share to the online subscription start-ups Dollar Shave and Harry’s.
P&G has found it hard to keep up with changing consumer trends. The net result has been stalling sales in the West. Procter & Gamble appears to have become a classic case of quality without growth.
Procter & Gamble: a lack of growth
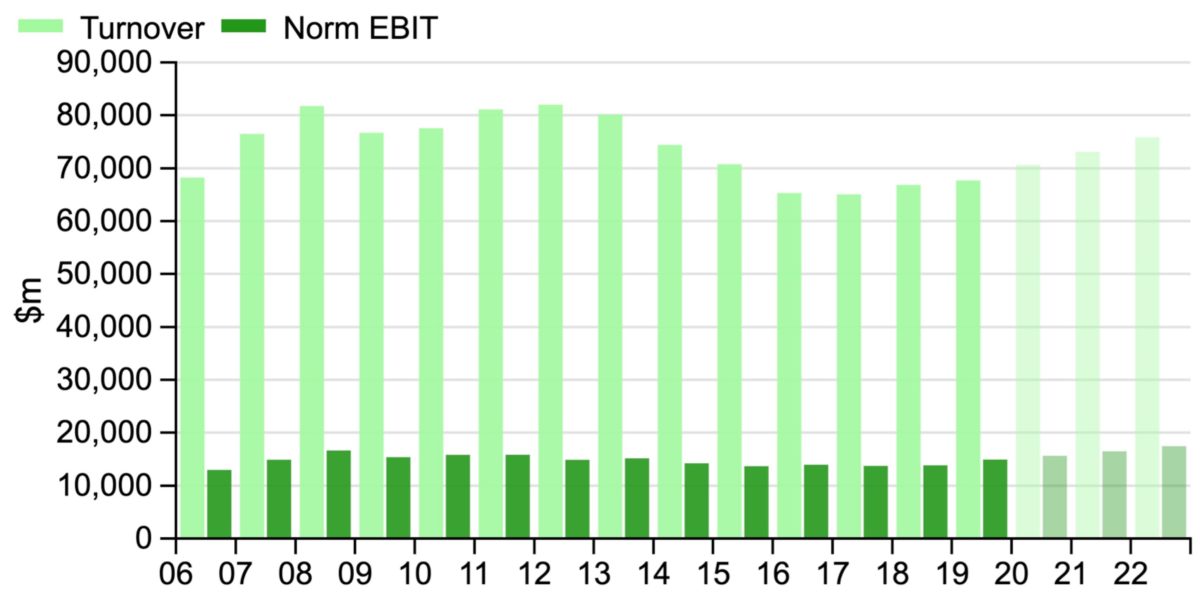
Source: SharePad
Coca-Cola (NYSE:KO) and PepsiCo (NYSE:PEP) are the second and third-largest US-listed consumer staple stocks. But per capita soft-drink consumption in the US fell for the thirteenth consecutive year in 2018.
US per capita soft-drink consumption (gallons): 2010 to 2018
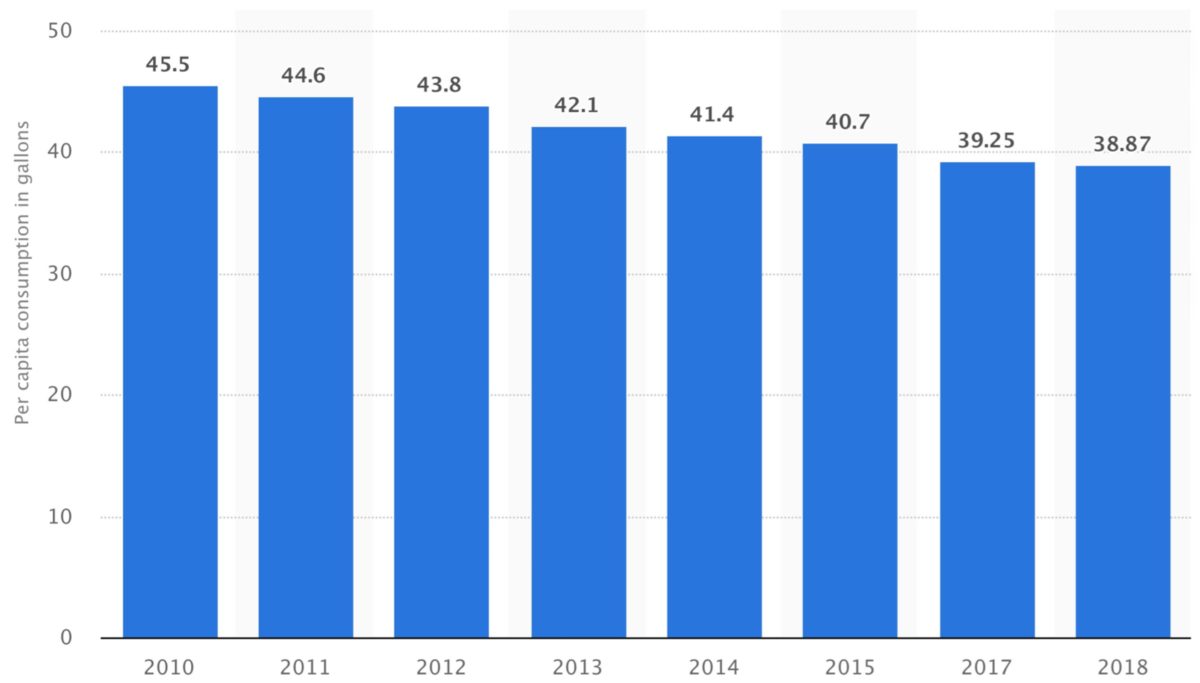
Source: https://www.statista.com/statistics/306836/us-per-capita-consumption-of-soft-drinks/
The tobacco giants Philip Morris International (NYSE:PM) and Altria (NYSE:MO) make up 12% of the S&P 500 consumer-staples sector. Declining tobacco use, increased regulation and a shift towards vaping products have become significant headwinds.
Growth at Colgate-Palmolive (NYSE:CL), Kimberly Clark (NYSE:KMB) and Campbell Soup (NYSE:CPB) has been uninspiring in recent years. Kraft Heinz has been particularly badly hit by a shift away from processed foods like Kraft macaroni and cheese.
All is not lost. Consumer-staple companies with strong brands and long-term growth drivers will continue to do well. Examples include the spirits group Diageo (LON:DGE) and the cosmetics groups L’Oreal (EPA:OR) and Estee Lauder (NYSE:EL).
Largest listed consumer-staple stocks
| United States | Sector % | Europe | Sector % |
| Procter & Gamble Co | 16% | Nestle | 24.6% |
| Coca-Cola Co | 11.1% | Diageo | 7.7% |
| PepsiCo Inc | 9.8% | British American Tobacco | 7.5% |
| Walmart Inc | 8.5% | Unilever NV | 6.5% |
| Philip Morris Int. | 7% | L’Oreal | 5.7% |
| Costco Wholesale | 6.8% | Unilever Plc | 4.9% |
| Altria Group | 4.9% | Anheuser-Busch | 4.8% |
| Mondelez International | 4% | Reckitt Benckiser | 4.4% |
| Colgate-Palmolive | 3.1% | Danone | 3.9% |
| Kimberly-Clark | 2.5% | Pernod Ricard | 2.9% |
Source: SharePad
If not the past, then what?
“The past is a foreign country; they do things differently there”. – L.P. Hartley
If the past is a poor guide to the future, what else should we use? The alternative is to adopt a qualitative and forward-looking approach. Our objective is to find companies that are able to generate and grow free cash flow.
We invest in order to get something back. This company valuation dependent on the free cash flow it generates. Free cash-flow generation is determined by the capital intensity of a business and its profit margins.
Free cash-flow growth is driven by the ability to attract more customers to an existing business franchise. The development of a new franchise can also work wonders, with the launch of the iPhone in 2007 transforming Apple’s fortunes.
Franchise power
I define franchise power as the ability to generate a high return in cash on invested capital. Capital intensity is in large part industry-dependent, with airlines inevitably capital intensive.
Profit margins are driven by cost advantages and the scope to charge premium prices. If the prices can be increased without a significant impact on demand, a product is said to have pricing power.
Loyal customers drive margins
The franchise power of a product is for the most part driven by the strength of the customer relationship. This is dependent on product differentiation; product superiority; and the time customers invest in a product.
If we cannot imagine living without something, we will remain loyal users, and this generally results in high profit margins. Microsoft Windows and Microsoft Office are two must-have products for the corporate world.
Businesses benefit from using the same operating system, with key software products designed to work on Windows. The financial world is tied into Microsoft Excel, with accountants trained on it and banks using it for financial analysis.
| Master Investor Magazine
Never miss an issue of Master Investor Magazine – sign-up now for free! |

Apple’s profit driver is the iPhone and the related high-margin services revenue, ie the App Store and licensing income. It can be hard to switch platform after becoming familiar with the iPhone’s operating system.
IT ‘moats’
Customers remain loyal if there isn’t a strong alternative. This makes competitive ‘moats’ crucial to long-term success. IT stocks increasingly benefit from the most powerful moat of all: network effects.
The more banks and merchants on the Visa (NYSE:V) and Mastercard (NYSE:MA) payment networks the more valuable they are. This makes it hard for competitors to get a look in – American Express’s (AXP) payment network is struggling in third place.
The IT sector increasingly involves significant customer switching costs, because software products take time to master. The high cost and risky nature of product development also gives incumbents an advantage.
Consumer-staples sector moats
The main competitive advantage for consumer-staple companies has been the appeal of their brands. But this is only an enduring moat if a product has a timeless brand, as appears to be the case for Coca-Cola.
At the same time, there are now alternatives to Coca-Cola, such as Fritz Cola, Karma Cola and Fever-Tree Cola. It is hard to think of a new competitor emerging for Microsoft Windows or the Visa/Mastercard duopoly.
Consumer-staple giants have enjoyed a distribution moat due to limited supermarket shelf space. But online distribution disrupts this advantage and supermarkets are increasingly offering high-quality, non-brand alternatives.
Consumer staples franchise/growth
The franchise/growth framework helps explain the diverging fortunes of the IT and consumer-staples sectors. Consumer-staple companies have benefited from the dominance of TV advertising in the past.
But online and viral marketing strategies have allowed new competitors to rapidly emerge. Dollar Shave’s first online advert went viral while the Halo Top ice-cream brand benefited from social media word-of-mouth.
The growth of the middle class in the West was a growth tailwind for the consumer-staples sector from 1968 to 2009. Increased knowledge has changed consumer preferences and has led to a shift away from established brands.
IT sector: from hardware to software subscriptions
The 10 largest global companies in 1999 included Microsoft, Cisco (NASDAQ:CSCO), Intel (NASDAQ:INTC), Lucent Technology and Nokia (HEL:NOKIA). Hardware companies are at risk of technological obsolescence and cyclical demand.
Software companies like Microsoft, the largest US stock in 1999, were dependent on volatile corporate spending. The IT sector has shifted from hardware stocks to software and payment companies.
The software sector itself has moved from one-off payments to a subscription model with products hosted in the ‘cloud’. This is known as Software as a Service (Saas) and has improved the quality of software groups.
SaaS means no big product launches, lower marketing requirements and products maintained centrally at a lower cost. The SaaS business model ensures that customers pay their dues − if they fail to do so, they are cut off.
IT sector
| United States | Sector % | Europe | Sector % |
| Apple | 20.2% | SAP | 26% |
| Microsoft | 19.2% | ASML | 15% |
| Visa | 5.2% | Amadeus IT | 6.4% |
| Mastercard | 4.3% | Prosus | 5.8% |
| Intel | 4% | Infineon | 5.2% |
| Cisco | 3.1% | Ericsson | 4.8% |
| Adobe | 2.6% | Dassault | 4.2% |
| Salesforce.com | 2.5% | Nokia | 4.1% |
| NVIDIA | 2.3% | CapGemini | 3.7% |
| PayPal Holdings | 2.1% | STMicro | 3.2% |
Source: SharePad, iShares
IT sector growth
Global IT spending is forecast to grow 3.4% in 2020, according to Gartner. Key drivers include the shift towards cloud computing, increasing digital payment volumes and the growing use of software products.
Microsoft’s fastest growth division is the cloud-computing business Azure, which is second only to Amazon. The company has moved its Microsoft Office products towards a subscription payment model.
Apple’s main growth driver in recent years, the iPhone, has seen volumes plateau. But the group’s high-margin services segment is delivering rapid growth and the wearables segment is also performing well.
Visa and Mastercard are benefiting from the shift away from cash and towards digital payments. PayPal (NASDAQ:PYPL) is benefiting from the growth of online spending with the group having a long-established and trusted brand.
Adobe case study
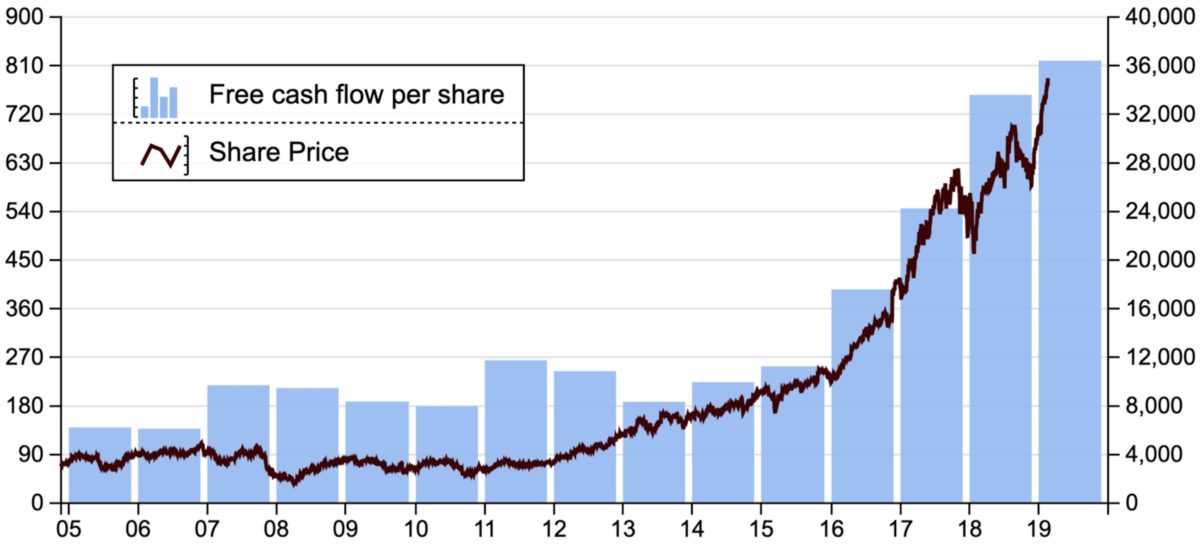
Adobe (NASDAQ:ADBE) makes a range of software products for graphic designers, creative professionals and website developers. The company has moved from one-off sales to software subscriptions, which has improved the quality of earnings.
The growth of internet use from 2009 has spurred demand and the net result has been rapid growth in free cash flow per share. Adobe highlights the change in fortune for some of the established IT companies.
Adobe’s transformation
Source: SharePad
Quality investors
Against this backdrop, we can consider how the leading quality investors were positioned at the end of 2019. The Lindsell Train Global Equity Fund has a 44.1% weighting in consumer staples and a 9.9% weighting in technology.
The Blue Whale Growth Fund has a 46.7% weighting in technology and a 6.4% weighting in consumer staples. The Blue Whale Growth Fund returned 27.6% in 2019 while the Lindsell Train Global Equity Fund returned 19.4%.
Sector exposure at the end of 2019
| Fundsmith Equity Fund | Smithson IT | Blue Whale Growth Fund | Lindsell Train Global Equity | |
| % IT sector | 30.4% | 40.2% | 46.7% | 9.9% |
| % Consumer staples | 31.8% | 3.9% | 6.4% | 44.1% |
| Consumer staple stocks | Philip Morris, Estee Lauder, McCormick | Fevertree Drinks | Unilever in 2019 | Unilever, Diageo, Heineken, Kao |
| 2019 Return | 25.6% | 33.2%* | 27.6% | 19.4% |
Source: Factsheets, *Net asset value
The Fundsmith Equity Fund had a 62% weighting in consumer goods and no technology exposure at the end of November 2010. The fund currently has a 31.8% weighting in consumer staples and a 30.4% weighting in technology.
The largest holding in the Lindsell Train Global Equity Fund, Unilever, recently warned on growth. The third-largest holding in the Fundsmith Equity Fund, Philip Morris International, has been one of the fund’s weakest performers.
The newer quality funds – Smithson (LON:SSON) and Blue Whale Growth – have a relatively high weighting in IT and a low weighting in consumer staples. This may reflect fresh thinking on where it is best to invest.
Summary
“The difficulty lies, not in the new ideas, but in escaping the old ones” – John Maynard Keynes
“When the facts change, I change my mind. What do you do, sir?” – John Maynard Keynes
The past is a guide to the future to the extent that the future mirrors the past. But much has changed since 2009. The past has been a poor guide to the IT and consumer-staples sectors.
In a period of change, the franchise/growth framework can help to identify attractive investments. Strong business franchises with long-term growth prospects will perform well. They are increasingly found in the IT sector.
Comments (0)