Quality Shares for a Bumpy Market

Financial markets are on a roller coaster this year. On the one hand, we have very unfavourable macro and geopolitical conditions. But, on the other hand, the ‘bulls keep buying the dips’.
On 4 May, for example, US markets rose after the Federal Reserve (Fed) announced a 50-basis-points rate hike. The Nasdaq rose by more than 3%. But, the day after, investors had second thoughts about the rate hike, which erased previous gains. This is all due to increasing uncertainty.
The near future looks less than rosy and the best option is to choose equities carefully. Today, I’m screening UK stocks, with the help of a few ratios, that I believe reflect the key characteristics to look for at the moment, which are: cheap, financially sound, low volatility and price momentum.
Poor macro conditions
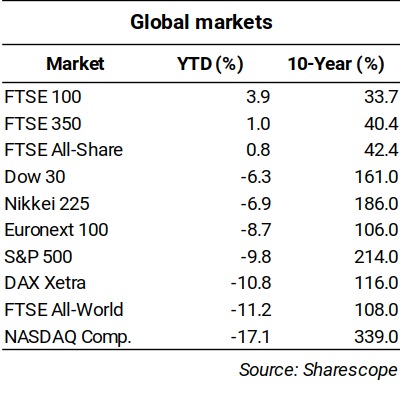
Macro conditions are poor at the moment, which is reflected in year-to-date market performance. Between 1 January to 4 May, the S&P 500 and the Nasdaq declined 9.8% and 17.1%, respectively. In continental Europe, the Euronext 100 contracted 8.7% and the DAX 10.8%.
In the UK, however, the picture has been brighter to date, with all key indices rising. The FTSE 100, in particular (and as expected to some extent), is doing very well due to the impact of commodities prices on the ‘heavyweights’ of the index. The more domestically oriented FTSE 250 is lagging, but still outperforming other markets in the developed world. The more conservative valuations and the exposure to commodities are advantageous for the UK market.
One of the hardest problems to solve is inflation. In the UK, prices are rising at an annual pace of 6.2%, a record level for the last 30 years. In the US, inflation is currently showing a reading of 8.5%. While these numbers are increasing, key interest rates are still very low. This means that both the Bank of England and the Fed are on a long path towards policy normalisation. The US 10-year T-Bond is now above 3.0% − a level that investors are usually afraid of, seeing it as a bad omen. On top of all this, we still have the war in Ukraine, which seems far from over and will continue to disrupt supply chains and contribute to high commodity prices.
Markets have been up and down. The chart below shows the Nasdaq Composite index over a period of five years. The average true range (ATR), which is a measure of daily volatility that takes into account opening, closing, maximum and minimum prices, is represented in the bottom part of the chart. The indicator shows several peaks, coinciding with market mini-crashes. In 2020, the ATR peaked in March due to Covid-19. It declined a little after that point but has been high during the whole period and is rising.
The big picture points to a potential recession or, at least, a slowdown. However, as the bull market for bonds is clearly over, the only remaining option is to carefully select some equities. So, let’s look at how we can select some above-average equities. We’re not looking to identify recession-proof assets but instead those that may be better equipped to weather turmoil.
Cheap, financially sound, low volatility and momentum
First, let’s create a simple screening system based on a few financial ratios that reflect fundamental (and technical) conditions.
To identify cheap/value stocks:
Enterprise value/EBIT
This is a ratio similar to price/earnings (P/E) but instead of considering the equity value, it takes into account the value of the whole company. It also considers operating profits instead of net profits, which are less vulnerable to manipulation. The lower this ratio, the better. When we revert the ratio, we get what’s often called the EBIT yield.
Enterprise value/turnover
Before making money, a company obviously must sell something, so there is no better measure than sales. The lower the ratio, the better.
To identify financially sound businesses:
Net debt to enterprise value
As leverage tends to be a problem during hard times, we’re looking for companies with sound balance sheets that can weather bad times without incurring financial trouble. The lower the net debt to the enterprise value the better. This ratio may be negative when companies carry more cash than borrowings, as net debt discounts cash holdings from the debt load.
Interest cover
Financially sound companies should be more than able to pay interest obligations with the profits they generate. Interest cover shows how many times the interest expense is covered by profits. Quality companies show a ratio of three, four or even more. This calculation assures us that, if the business cycle turns unfavourable, the company would still be able to pay interest without seeking external financing or shareholders’ dilution.
To identify market conditions:
Low volatility
To capture volatility, I use the standard deviation of past returns. This should give a picture of the volatility of the stock price. At volatile times, I prefer lower values.
Price momentum
A company may be trading cheaply while holding a strong financial position and still be out of favour for quite a while. Momentum is key in markets, as investors don’t want to wait forever for the market to recognise value. I’m therefore weighting the price performance relative to the FTSE 350 here.
Selection process
If you are already acquainted with my share-selection process based on relative value and construction of ratings, you may wish to skip this section.
As I have mentioned in past articles, there are several ways of screening stocks to create a shortlist. The most common route involves requiring each of the previously mentioned ratios to lie within a range of values, or to be higher or lower than some predefined value. However, setting restrictive conditions, like P/E < five and interest cover > 10, will often end with an empty list. Value is a relative concept.
The idea behind screening is to filter shares that are potentially above average and then build a sufficiently large portfolio of them to reduce idiosyncratic risk. I’m therefore just collecting the numbers through the screening process to then attribute ratings to each share on each ratio, based on desirability.
I rank shares on each ratio, from best to worst and then attribute a rating to each. If I have 500 shares, I give a rating of 500 to the highest rank, 499 to the second best, and so on towards the lower tail of the list until reaching a rating of one. I repeat the process six times, once for each ratio collected. The last step involves summing up the ratings to reach an overall rating for each asset. After this, we can rank everything again by this final figure and select the top spots.
Unlike the absolute value screener, we always get a rank of shares from best to worst. Also, this list allows for the construction of a long-short portfolio and to attribute weights, as desired. For this particular case, I’m weighting all stocks equally. One very simple way of building a rating-weighted portfolio would be to sum the overall ratings of the shares selected and then invest in each of them in a proportion equal to the ratio of its rating to the overall rating.
My top 10 picks
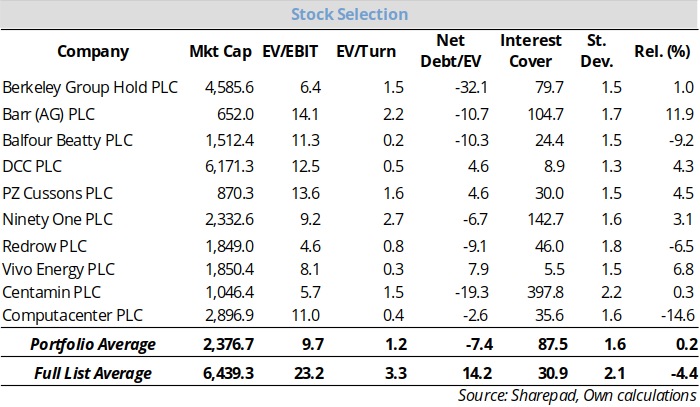
My final list includes Berkeley Group, Barr, Balfour Beatty, DCC, PZ Cussons, Ninety One, Redrow, Vivo Energy, Centamin and Computacenter. Clearly construction and commodities are well represented, which reflects the current, favourable scenario.
A closer look at the table shows that we are selecting a portfolio of companies that on average rank much better on the selected ratios than a company from the full list. Provided that the selected ratios really capture value over the market average, all we need to do is to select a decent number of shares to reduce idiosyncratic risk and wait. It’s a kind of statistical play that has many advantages over other selection processes. We can define tight rules and follow them when investing, putting sentiment completely aside.
Comments (0)