Is Unilever still a no-brainer for dividend investors?

There are few defensive dividend-payers more obvious than Unilever (LON:ULVR). The company’s long track record of steady dividend growth, powered by an array of defensive consumer brands such as Domestos bleach, Ben & Jerry’s ice cream and Matey bubble bath, has given the company a devoted following of very happy investors.
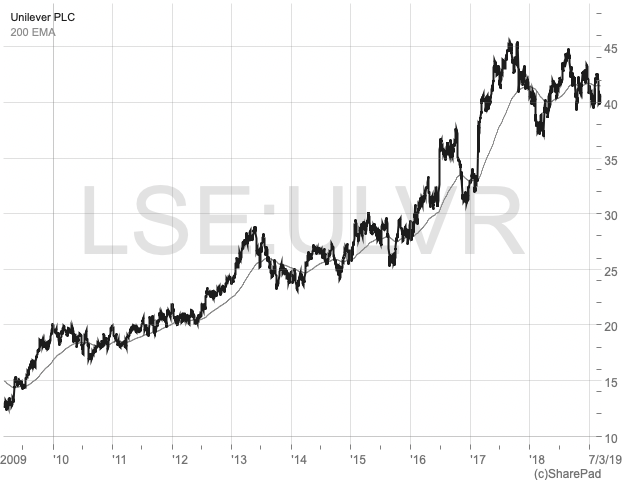
And Unilever’s investors are right to be happy. After all, the company’s share price has almost tripled since 2007. With dividends included, the company’s UK investors have seen average returns of almost 15% per year for more than a decade.
But have these impressive annualised returns left the company overvalued, or is Unilever still the ultimate no-brainer? Let’s try to find out by asking a few basic questions.
Has the company had a consistent business model?
YES: Unilever has been selling fast moving consumer goods (products which people buy repeatedly and frequently) for almost a century. It started out as a margarine and soap manufacturer and has since acquired or developed a wide range of other non-durable consumer products. Those products are currently grouped into Beauty & Personal Care, Food & Refreshments and Home Care.
| First seen in Master Investor Magazine
Never miss an issue of Master Investor Magazine – sign-up now for free! |

Most of the company’s success and profitability comes from the strength of its brands, rather than the quality of its products (although I’m not saying its products are low quality; just that the brand is more important). 13 of these brands generate revenues of more than one billion euros, including Dove soap (Beauty & Personal Care), Magnum ice cream (Food & Refreshments) and Surf washing powders and liquids (Home Care).
Over the years, Unilever’s business model has remained very consistent. That business model is, in very simple terms, to develop awareness and trust of its brands in consumers through marketing, and then to sell those branded goods to consumers at a price point above less well-known competitors. This generates higher profit margins which are then used to fund additional marketing, and so the cycle continues.
A very simple example would be Magnum ice cream. You wander into a shop on a hot day and open the ice cream freezer. Inside is a Magnum for £2. Next to the Magnum is a very similar looking but unfamiliar ‘choc ice on a stick’ for £1.50. You know what a magnum tastes like and you have no Idea what the other one tastes like. If you buy the Magnum for £2 you know you won’t have wasted your money, but if you buy the other ice cream for £1.50 you may not like it. So, you buy the Magnum for £2 and Unilever gets a sale with a wider profit margin than its less well-known competitor.
While the business model has remained largely unchanged, the company’s portfolio of brands has gradually evolved over the years. Acquisitions and disposals have occurred on a regular basis as management try to continuously improve the portfolio. In the last ten years alone, the company spent around £14 billion on acquisitions. That’s a lot, but I don’t think it’s excessive as Unilever generated net profits of almost £50 billion over the same period.
Does the company have a successful track record?
YES: Unilever has had a very successful decade or so and, in fact, its success stretches back much further than that. But let’s focus on the period from 2007 – i.e. just before the financial crisis kicked in.
Here’s the good news. In 2007, Unilever’s dividend was 75 cents (Unilever’s dividend is paid in pounds and euros as it’s listed on two separate stock exchanges, but the rest of its results are in euros, so I’ll stick with that currency). In 2018, the dividend had grown to 155 cents. That’s an increase of 107% in 11 years, giving the company an annualised dividend growth rate of 6.8% per year. That’s quite impressive for such a large company selling defensive items such as soap and washing powder (these items are defensive because people will buy soap even in the deepest of recessions).
But that’s not the end of the story because dividends don’t exist in a vacuum. In the long run, they should be covered by earnings, so we should look at the company’s per share earnings to see if they’ve kept pace with dividend growth.
Back in 2007, Unilever reported earnings per share of 128 cents. In 2018, its earnings had increased to 350 cents. That’s an impressive amount of growth at just over 170% in 11 years. However, the 2018 earnings were boosted by a one-off gain when Unilever sold its spreads business (including brands such as Flora margarine) due to consistent underperformance. The sale boosted Unilever’s pre-tax profits by 4.3 billion euros and, in this instance, we should strip out this one-off gain as it has nothing to do with Unilever’s core business. We can do this by looking at Unilever’s ‘underlying’ earnings.
Unilever’s underlying earnings are stated at 236 cents for 2018, which is almost double the 2007 figure of 128 cents. To be precise, it’s an increase of 91% in 11 years, or 6.1% annualised. So, both earnings and dividends have increased by about 100% since 2007, which is quite impressive.
The company’s earnings have consistently covered its dividend, but dividend cover has fallen from 1.7x in 2007 to 1.5x today. This may be entirely sensible as the company, now much larger than before, may have less opportunity to reinvest earnings for growth. In that case, paying out a higher portion of earnings as a dividend makes sense.
Unilever has also generated enough free cash to afford those dividend increases, with free cash flow covering the dividend on a consistent basis (free cash is cash generated by business operations minus interest, tax and capital expenses, which is then available for acquisitions, share buybacks or dividends).
The next item I like to look at is revenues, because without long-term revenue growth there can be no long-term earnings or dividend growth. Looking back at 2007 again, Unilever reported revenues of just over 40 billion euros, or 1,409 cents per share. By 2018 those revenues had grown to 51 billion euros, or 1,950 cents per share. On a per share basis, that’s an increase in revenues of 38% over 11 years, which is an annualised growth rate of 3% per year.
| First seen in Master Investor Magazine
Never miss an issue of Master Investor Magazine – sign-up now for free! |
This is interesting. The company’s revenues have grown about half as slowly per year as its earnings and dividends. The result is total revenue per share growth which is about a third of its earnings and dividend growth since 2007. How can that be? How can a company drive up earnings and dividends without driving up revenues to the same extent?
The answer is that Unilever increased its return on sales, or net profit margins, from 9% in 2007 to 12% today. This has come about in a variety of ways, such as: a) moving from lower margin spreads to higher margin personal care products; b) improving operational efficiency and stripping out costs; and c) premiumisation, where lower margin mass market products are given a makeover, plus a few tweaks to the ingredients, and then sold at a higher price point. One example of premiumisation is Domestos Power Fresh Ocean Toilet Gel, which sells for about twice the price of standard thick Domestos bleach.
As with dividends growing faster than earnings, earnings growing faster than revenues is also not sustainable in the long-term. Eventually Unilever will have stripped out all excess costs, shifted completely to higher margin products and premiumised the living daylights out of them. In other words, the company’s recent margin expansion is a one-off tail wind which will have to be replaced, at some point in the next few years, with a different driver of long-term growth.
Does the company have good long-term prospects?
YES: Unilever has a relatively deep and wide economic moat to protect it from competitors. That’s because large numbers of people tend to stick with certain brands for very long periods of time. They may have used Dove soap for 20 years and will keep on using it for as long as they live. Or they remember using Matey bubble bath as a child so they use it to wash their children who, eventually, may use it to wash theirs. This brand stickiness means Unilever doesn’t have to compete aggressively on price with less well-known brands.
Brand stickiness also gives Unilever an enviable degree of predictability. As long as the world’s population grows in number and wealth, it’s hard to imagine a future in which Unilever is not selling more branded products to more people in more countries, ten, twenty or thirty years from now. So, I don’t think the key question is whether Unilever has good long-term prospects. I think the key question is how prosperous (i.e. how big) will it be, and how quickly will it get there?
In terms of how big Unilever can be, I’m sure there’s lots of room for growth.However, Unilever is a very large and very mature company. We know that individual companies cannot grow faster than the rest of the economy indefinitely, and as they approach their maximum possible size their growth rate tends to slow down, with each decade’s growth typically being slower than the previous decade’s.
One way to measure the long-term growth of a company is to look at how much capital (provided by shareholders and debtholders) the company is putting to work, or ‘employing’. We can do this for Unilever, looking at capital growth across two separate ten-year periods from 1998 to 2007 and 2009 to 2018.
In 1998, Unilever was employing about 9.3 billion euros of capital; 4.7 billion in the form of shareholder equity and 4.6 billion as debt capital. Fast forward ten years to 2007 and Unilever’s capital employed had increased to 22 billion euros, with 12.4 billion coming from shareholders and 9.6 billion from debt holders. That’s an increase in capital of 137% in ten years, or just over 10% per year. During that decade, Unilever’s average return on capital was 15.2%, which is above average.
Let’s have a look at what happened in the following ten years. In 2009, the company still had 22 billion euros of capital employed. By 2018, that capital had grown to 26.5 billion, largely because the company’s debts had grown from 10 billion euros in 2009 to 24.9 billion in 2018. Even with this debt expansion, Unilever’s capital had only grown over those ten years by 65%; equivalent to 6% growth per year. During this ten-year period the company managed to achieve a slightly higher average return on capital of 17%.
| First seen in Master Investor Magazine
Never miss an issue of Master Investor Magazine – sign-up now for free! |
This is exactly what I’d expect to see. As a very large company becomes even larger, the growth of its already enormous capital base begins to slow. And because returns on capital employed from a particular business model tend to be quite stable over time, I would also expect to see its earnings growth slow, which ultimately leads to a slower dividend growth rate.
This doesn’t mean I’m bearish on Unilever. It just means I think its growth rate in the future is very likely to be slower than its growth rate in the past. Its increasing size alone would be a major factor in this slowdown, but I can think of other headwinds such as changing consumer tastes in the west (where younger people tend to like newer brands rather than brands they grew up with), the ease with which new competing brands can scale (thanks to the internet and social media) and the ever-present threat of Amazon and its rapidly expanding range of Amazon Basics products.
Overall, I think Unilever is likely to have a prosperous future, but unless the company can significantly and sustainably boost its capital and revenue growth, it will eventually have to settle for a lower earnings and dividend growth rate than investors have become used to.
A reasonable ballpark estimate would be that Unilever can achieve some sort of middle ground between its historic ten-year revenue growth rate (3.5%), its capital growth rate (6.2%) and its dividend growth rate (7.9%). The average of those three is 5.9%, and I think that’s a reasonable and possibly optimistic estimate of Unilever’s dividend growth rate for the next decade.
Is the company available to buy at an attractive price?
As I write, Unilever’s share price is 4,246p, giving the company a dividend yield of 3.2%. Using the dividend yield plus growth model, that would imply returns of about 9% per year over a five or ten-year period (about 6% from dividend growth using the assumptions in the previous section, and about 3% from dividend yield). An estimated high-single digit return is not brilliant, but it’s not bad either.
I also maintain a stock screen which ranks FTSE All-Share companies based on a combination of their growth rates (across revenues, capital and dividends), growth consistency, profitability and debt levels, as well as valuation ratios such as price to ten-year average earnings and dividends. There are 186 companies in this list, so halfway – position 90 – is about average. The FTSE 100 is included in the list as a benchmark, and it currently sits in position 88, more or less where I’d expect it to be. Unilever, on the other hand, is ranked 59 out of 186, which implies that it has a more attractive combination of growth, consistency, profitability, leverage and value than the average company.
I tend to restrict purchases to the top 50 stocks, so it’s not quite in that range. For me to buy Unilever its price would have to drop below 3,500p at the very least, which is less than a 20% decline from where it is today. At that point it would have a yield north of 4%, but that would be unusual for Unilever so I’m not holding my breath.
Although I wouldn’t buy Unilever at its current price, I would be quite happy to hold at current levelsand I think the shares are far from overvalued. They’re not super cheap, but they are perhaps slightly cheap. So, is Unilever still a no-brainer for dividend investors? I think it probably is, but investors shouldn’t expect the sort of 15% annualised returns achieved over the last decade.
Comments (0)