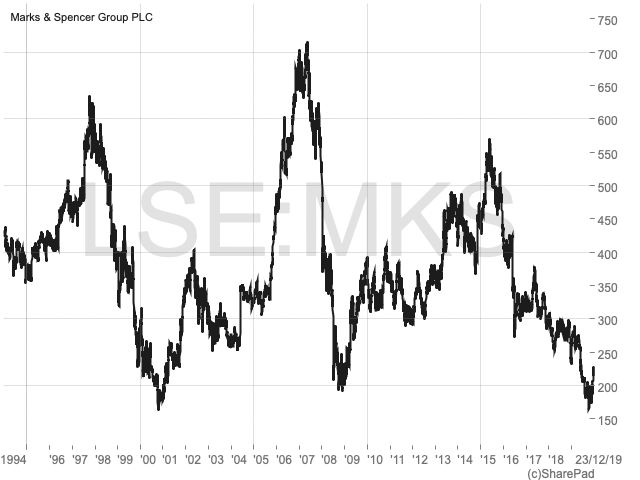
Marks & Spencer: the destroyer of shareholder value

John Kingham of UK Value Investor explains why Marks & Spencer has been a long-term destroyer of shareholder value and reveals how you can avoid investing in similar situations in future.
I like Marks & Spencer. No, really, I do. I used to buy most of my clothes from M&S back in the late 1980s and early 1990s, when I was in my late teens and early 20s. The clothes were well-made, the designs were fashionable and the consistency of quality and sizing was second to none (at least on my local high street).
But that was a very long time ago and since then M&S has lurched from crisis to crisis, carrying out what seems to be an endless transformation project to “make M&S special again”.
The latest attempt to turn M&S around includes a £750 million joint venture with the UK’s leading online-only grocer (Ocado) to enable customers to do their M&S food shopping from the comfort of their own home. This venture has been funded largely by a rights issue in which shareholders pumped an additional £600 million into the company, and that £600 million is just the tip of the iceberg.
Over the last 20 years, M&S has retained about £2.5 billion of shareholders’ earnings to invest in the existing business, to make acquisitions, buy back shares and so on. And yet, after all that hard work and investment of cold hard (shareholders’) cash, the company’s share price is lower today than it was 20 years ago.
For most shareholders then, M&S has been a disaster for at least two decades. So, in the rest of this article I want to explore two ‘red flags’ which, for many years, have suggested that M&S was a no-go area for long-term investors.
Red flag 1: Consistently weak returns
Companies exist to produce adequate or better returns on capital raised from shareholders. Shareholder capital, also known as shareholder equity, can be supplemented with debt capital (debt liabilities or borrowings) and leased capital (lease liabilities, eg for rented stores). Regardless of the source of capital, returns on that capital must be sufficient to offset the risk that shareholders are taking.
If a company can consistently produce returns on capital which are above the market rate of return (around 7% to 10% in the UK) then it makes sense for that company to reinvest some of those returns. Reinvested earnings will increase the size of the company’s capital base and that will, hopefully, lead to revenue, earnings and dividend growth in the future.
On the other hand, if a company cannot consistently produce returns on capital employed which match the market average, then that company should focus on returning capital to shareholders through dividends. In more extreme cases, it will make sense to sell off parts of the business or even close the whole business, in order to return capital to shareholders so that they can reinvest it more productively.
It’s a bit like putting money into a savings account. If the interest rate is 15%, then it’s probably a good idea to reinvest the interest back into that same account because you’re unlikely to get a 15% rate of return anywhere else. But if the interest rate is 2% then you might be better off withdrawing the interest − and perhaps the rest of your savings − and investing it somewhere else.
So, what does that have to do with M&S? Quite a lot, as it turns out.
| Master Investor Magazine
Never miss an issue of Master Investor Magazine – sign-up now for free! |

Over the 10 years from 2000 to 2009, M&S employed an average of £2.5 billion of shareholder equity, £2.3 billion of borrowings and £1.6 billion of lease liabilities (discounted at 5% per annum), giving it an average lease-adjusted capital employed of £6.4 billion. Over the same period, it generated average revenues of £8.3 billion and, after deducting all expenses, average earnings of £0.4 billion. That gives M&S an average net return on lease-adjusted capital employed (net ROLACE) of just 6.7%, well below the 10% rate of return I typically look for.
In the most recent decade, from 2010 to 2019, things have got worse. Lease-adjusted capital employed has increased to £8 billion, thanks in part to the reinvestment of retained earnings, but average earnings have fallen below £0.4 billion. As a result, M&S’s average net ROLACE has decreased to just 4.6%, which is extremely low.
There are many reasons why a company might have weak profitability, but in M&S’s case it is at least partly due to its habit of leasing stores on extremely long terms. This may be seen as a sign of confidence in the company’s future, but when the retail market is evolving as quickly as it is today, it can also be seen as carelessness or even arrogance. For example, in 1971 M&S agreed to lease a store in Stockton high street for an incredible 283 years. This lease alone gives M&S a liability of around £33 million. And the most unbelievable thing is that the store is now closed, so M&S could be paying rent on an empty store until the middle of the twenty-third century.
There are also clear differences in performance between M&S’s clothing and food businesses, with food consistently outperforming clothing. However, until M&S separates its clothing and food operations into two entirely separate companies owned by the group (which I think it should do) there simply isn’t enough accounting information to calculate separate ROLACE figures for each business. This means I have to assume that each is as bad as the other.
In summary then, M&S’s consistently low returns on capital suggest that the company is competitively weak and is at risk of being rendered obsolete by competitors (especially the clothing business). This is an important red flag and it’s why I haven’t invested in M&S, despite its attractive dividend yield in recent years.
In my opinion, management should have focused on improving returns on capital, and if that was impossible, then they should have focused on returning capital to shareholders by favouring dividends over reinvestment. Instead, shareholders were subjected to an endless round of turnaround and transformation projects aimed at returning the company to growth.
I think this was a mistake because reinvesting earnings to drive growth in a company that produces low returns on capital simply destroys rather than creates value for shareholders, just as reinvesting savings into a 2% savings account destroys value compared to withdrawing it and saving it elsewhere at 5% or 10%.
Red flag 2: High debts
For most companies that produce consistently low returns on capital, growth can be very hard. Here’s an example:
Company A builds a factory for £100 million. The factory makes widgets and at the end of the year it has produced earnings of £5 million − a 5% return on the capital invested. Management decide they want to build another factory, but with earnings of just £5 million per year, it will take them 20 years to save up the money to build the second factory.
| Master Investor Magazine
Never miss an issue of Master Investor Magazine – sign-up now for free! |
Company B also builds a factory for £100 million, but this factory produces earnings of £20 million, giving a 20% return on capital employed. Company B also wants to build another factory, but because of the higher rate of return, it only has to save up its earnings for five years before it has the £100 million required to build that second factory.
As you can see, low-return businesses have a much harder time growing by reinvesting earnings, because their earnings are so low relative to the cost of their assets. However, it’s easy to get around this problem by borrowing the money from a bank, and this is why many low-return businesses also have high levels of debt.
Using borrowed money to invest in productive assets will boost returns on shareholder equity, so some shareholders and managers are happy to load a company up with debt in order to boost growth. But funding growth with borrowed money doesn’t really create value, it simply redistributes who has a claim on those returns (ie debtholders now as well as shareholders) while increasing risk within the business.
In Marks & Spencer’s case, it had average borrowings of £2.3 billion between 2000 and 2009 compared to average earnings of £0.4 billion. This gave it an average debt-to-earnings ratio of 5.4, whereas my preferred maximum for cyclical companies such as retailers, is 4.0. So, M&S had at least 30% too much debt in my opinion, and given its weak returns, its debts should probably have been less than half their actual amount.
And things haven’t improved in the last decade. From 2010 to 2019, M&S had average borrowings of £2.2 billion and average earnings of just under £0.4 billion, giving the company a debt ratio of 5.9. That’s almost 50% higher than my preferred limit.
Somewhat more positively, the company has at least reduced its debts to around £1.8 billion today, which is a start. But its earnings have also collapsed to almost nothing over the last three years, so even this reduced level of debt is far too much for my liking.
Long-term financial results are important
I realise I haven’t spoken about what’s going on with M&S today, or what might happen in the future if its current transformation project bears fruit, of if the deal with Ocado really does revolutionise the online grocery world. It’s not that those things are not important, because they could be. But for me, the process of selecting an investment starts with a detailed look at the company’s long-term financial results.
First and foremost, I’m looking for companies that can consistently produce above-average returns on lease-adjusted capital employed. And of those, I’m looking for companies that can consistently grow their capital base by reinvesting retained earnings at similarly attractive rates of return.
M&S doesn’t pass either of those tests, which is why I haven’t gone into the details about its deal with Ocado. There is just no evidence that M&S can transform itself without destroying billions of pounds of shareholder value along the way.
Next: high returns, low debts
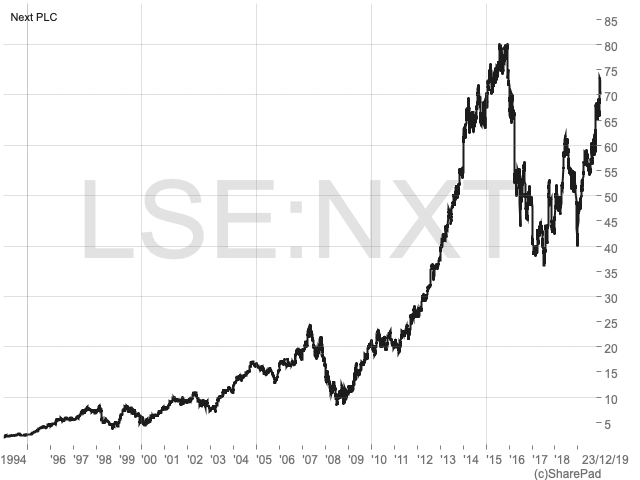
Some investors are avoiding retail altogether because of the online shopping revolution. That’s a reasonable position to take, but I still own some retail investments, including Next. I would describe it as a clothing/fashion retailer which is (sort of) like M&S − but for younger people and without the odd combination of clothing and food in one business. It’s also a good example of a highly profitable retailer.
Looking at the last decade, Next had average shareholder equity of £0.3 billion, average borrowings of £0.8 billion and average lease liabilities (discounted at 5% per annum) of £1.4 billion, giving the company an average lease-adjusted capital employed of £2.5 billion. That capital was invested in stores, stock and other assets to produce average revenues of £3.8 billion and average net earnings of £0.5 billion.
An average return of just over £0.5 billion from average capital employed of £2.5 billion means that Next produced average net returns on lease-adjusted capital employed of 21%, which is more than four times the rate of return achieved by M&S over the same period. Just as importantly, Next’s ROLACE was well above 10% in every single year, showing that high levels of profitability were the norm rather than the exception.
These higher rates of return have allowed Next to reinvest earnings at a rate of return of 21% or so, and that has fuelled a growth rate across revenues, capital employed and dividends per share of about 8% per year for the last decade. In contrast, and despite much reinvestment of earnings, M&S has not grown at all over the same period.
And because Next’s returns are so much higher relative to the cost of its assets, it hasn’t had to borrow much to fund that growth. So, unlike M&S’s average debt-to-earnings ratio of 5.9 over the last decade, Next has got by with average debts of just 1.6-times its average earnings.
This lower level of borrowing, along with Next’s far shorter leases, means that Next’s cost base is significantly more flexible at a time when flexibility is critical if retailers are to survive the digital transformation of retail.
For long-term investors, profitability comes first
There are, of course, many other things we’d need to look at before investing in any business. However, for long-term investors, profitability is the single most important factor.
So, when you’re looking for your next long-term dividend-paying investment, I suggest you start with net returns on lease-adjusted capital employed. Look at the average over 10 years and focus on those companies where returns are consistently above 7%, and preferably above 10%.
Comments (0)