European Safe High Quality Dividend Payers

If there was a good time to seek for yield during the last few years, it is now. Since bottoming during the pandemic, bond yields have been rising quite fast. The interest rate hikes triggered by central banks and the correction observed in stock markets last year, contributed to an increase in yields. After a small pause for the last quarter of 2022 and the beginning of 2023, yields are on the rise again. Ten-year government bonds currently offer 4.5% in Italy, 4.0% in the US, 3.9% in the UK and 2.7% in Germany. Even in Japan, where yields remained below water level for long, they’re now at 0.5%. These levels were last seen more than a decade ago, when the Great Financial Crisis and the European Sovereign Crisis depressed yields. With inflation running low at the same time, it was hard by then to find quality stocks paying attractive dividends.
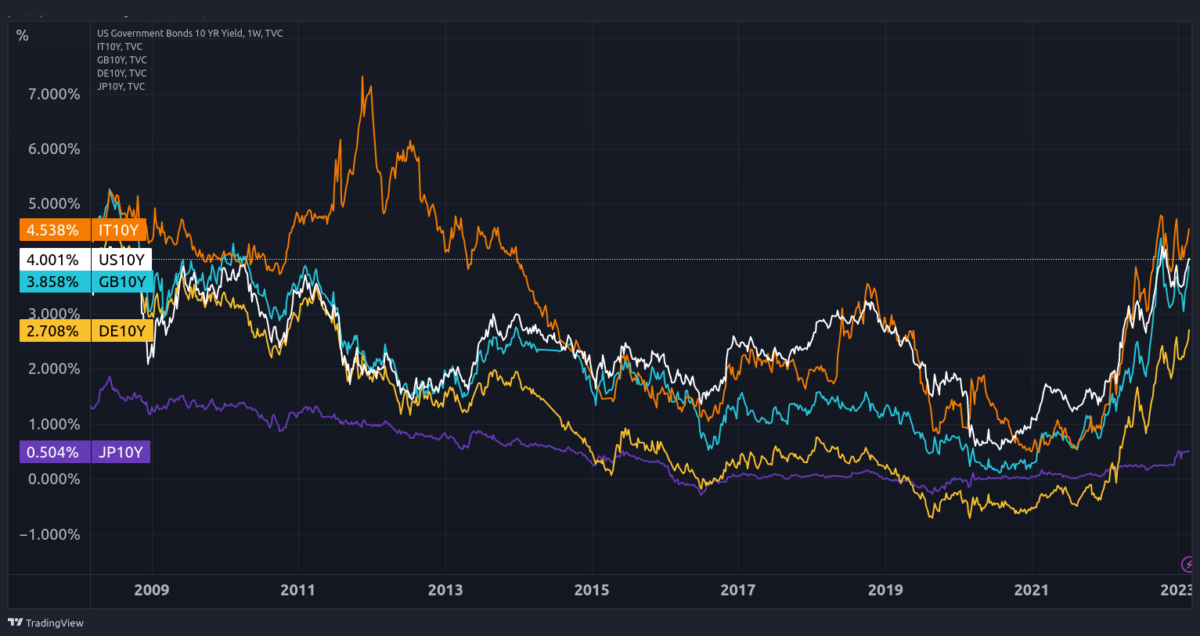
Fig. 1 – 10-year government bond yields (Italy, US, UK, Germany and Japan).
Now the scenario is different. Interest and inflation rates are much higher than two years ago. In Europe, the ECB and the BoE are far from being done with rate increases, as inflation keeps jumping higher. Value stocks, which are those usually paying dividends, are currently undervalued in comparison to growth stocks. In my view, the odds for a global recession are increasing. To that extent, this may be a rough time to invest in equities. But, if investing, value stocks are those offering the best protection at this point. The current dividend yields are an additional layer of opportunities for those looking for income. If we could pick stocks trading on decent yields, all we had to do is to make sure they are sitting on good finances. We need a screener that is able to pick high-quality dividend-payers. So, let’s build it. Those more sceptical about using screeners to pick stocks, can still use them as a first filter and then hand pick stocks from a much shorter list.
A Filter For High-Quality Dividend Payers
There are many different ways to do this. I’ve learned that keeping things simple is probably the best way to go, so I’m going to build my investment strategy by focusing on just a few ratios. The goal here isn’t to build the perfect dividend strategy but one that works at tilting the portfolio towards quality dividend payers. Let me start by selecting a market. Today I’m going to concentrate on European stocks. I believe there are some good gems there! My starting list has more than 1,700 European names on it. You can adapt it to your own goals and select other markets like the FTSE 100, the S&P 500 or any other. The next step involves applying a few filters to the list to make sure I’m selecting quality dividend payers. Finally, I apply a rating system to the reduced list and rank stocks according to a few ratios. In the end, I just have to select the top spots from the rankings list.
1) Dividend yield >= 3%
This filter allows excluding stocks with a poor dividend yield. However, I don’t want to keep the bar too high, to the point of excluding too many stocks. If low yields aren’t appealing, high yields may mean trouble, in the form of overvaluation or an upcoming dividend cut. I want reasonable dividends to later apply other quality filters. The dividend yield is just part of the story.
2) Dividend cover >= 1.5
The dividend yield is based on past dividends and current stock prices. We don’t know if the company is going to pay dividends at the previous level. What we do know is that companies usually don’t cut dividends if they can pay them. And to that extent, nothing better than looking at their capacity to keep paying dividends. The dividend cover ratio is a good metric to get an idea about the ability of a company to pay dividends. The higher the dividend cover, the higher the cash flow available to cover dividends. I select a minimum ratio of 1.5x to avoid excluding some great companies where low ratios may be enough to assure dividend payment.
3) Number of consecutive dividend payments >= 7
As a matter of refining the likelihood of getting a dividend, I select companies with a good track record of paying them, every year. It is said that economic trouble occurs every seven years. If a company can keep paying dividends over that time period without problems, it passes this filter. If you’re more picky than me, you can increase the interval.
4) Relative performance >= -15%
This filter isn’t required but, I don’t want to pick falling knives. If a stock is underperforming its corresponding country’s main index by a large margin, then we better keep it away from our portfolio. In general, I like to pick value stocks, but not during a free fall.
In order for the next step to be possible, I further exclude stocks without ROCE and EBIT yield records. The final list is made up of 101 stocks. I use the ROCE 7-year average and the trailing 12-month EBIT yield to evaluate the quality of the stocks. A high ROCE indicates profitability, which ultimately contributes to the sustainability of dividend payments. The EBIT yield is the inverted P/EBIT ratio, which is similar to the P/E ratio (but far superior). Higher values indicate cheapness, and are thus better.
Building My Ranking Strategy
As I mentioned at the beginning of this blog, my goal isn’t to capture high yield but rather high quality yields. Therefore, after filtering the stock list using the four ratios above, I’m now going to build a ranking.
I rank the 101 stocks that passed the filters above based on ratings attributed to the following ratios:
- Dividend yield
- ROCE 7-year average
- EBIT Yield TTM
At ranking stocks on these three ratios, I’m taking into consideration income, profitability and cheapness. I start with the first ratio, ranking stocks. A rating of one is given to the worst-ranking stock, a rating of two to the next, and so on. The best-ranked stock collects a rating of 101. Then, I repeat this procedure for the second and third ratios, one at a time. When it is completed, each stock has three ratings. In all cases above, higher values are better, therefore higher ratios receive higher ratings. The final step involves summing the ratings to get an overall rating number.
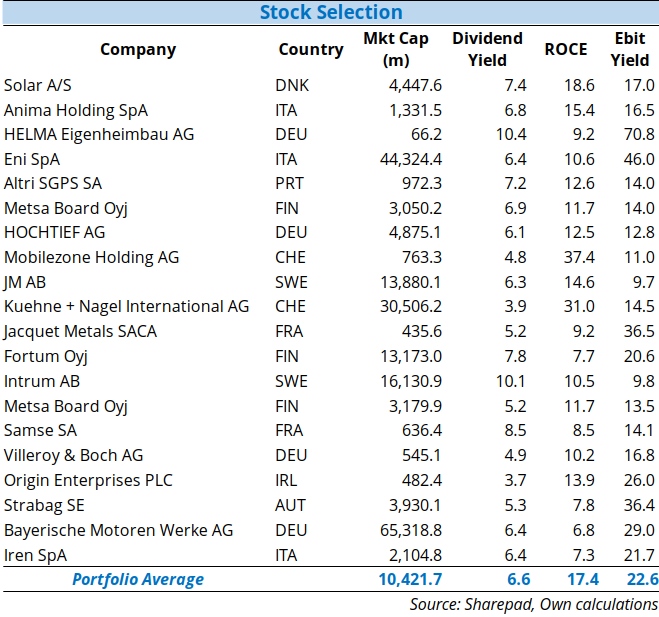
Fig. 2 – Stock selection.
I selected a list of 20 stocks to capture high quality dividend payers from several European countries. The top spots include Solar, Anima, Helma Eigenheimbau, Eni, Altri, Metsa, Hochtief, Mobilezone, JM and Kuehne Nagel . Note that, while I started with a yield filter of 3%, the final portfolio includes companies with an average yield of 6.6%. This is because the ratings’ system attributes a higher rating for higher yields. At the same time, the inclusion of the additional ratings on ROCE and EBIT yield allows us to capture profitability and cheapness. We want high dividend-paying stocks that trade on good fundamentals. That’s exactly what this final list is about.
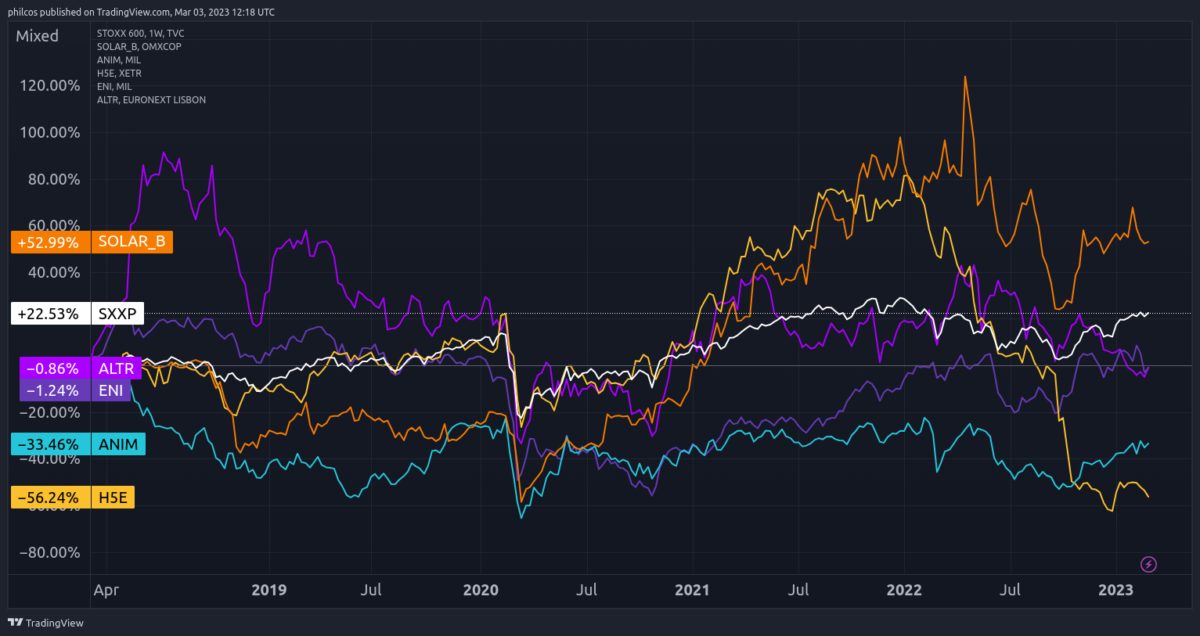
Fig. 3 – Solar, Altri, Eni, Anima and Helma relative to the Stoxx 600 index.
Fig 3 is wrong and ticker symbols would be appreciated. Thanks for the hard work.
OK, I am not confident buying individual stocks like this – I just can’t keep track of them all. How do I find which investment trusts, OEICs or ETFs have the closest match to this mix of stocks? Most data pages for these collective vehicles at e.g. Trustnet or Citywire only give the top 10 holdings, and even then there’s easy way to search and filter – you have to check each vehicle manually and make the comparison yourself.