What is the relationship between oil and equities?

The correlation between oil prices and equity prices has always been shrouded in mysticism, with no one being able to come up with a clear cut explanation for the relationship between the two. Many studies point to a strong relationship between the returns on oil and equities; many others point to the absence of any relationship. Even when correlation is found, it is sometimes labelled as positive, while at other times being labelled as negative. For the most part of the 2000s the correlation between the stock market and oil prices was tame at best; but lately, the relationship is gaining some strength, leading many traders to split their monitors between the S&P 500 and WTI Oil, waiting for a clue.
The correlation between S&P 500 returns and WTI returns since the beginning of 2000 until now has averaged 0.17. When replacing the S&P 500 with the FTSE 100 the same increases to 0.20; and if we take the MSCI World instead it rises even more to 0.23. Nevertheless, these numbers suggest that on average oil prices and equity returns don’t have much in common, which would suggest that current oil prices don’t explain current equity prices or vice-versa. If you’re looking for guidance for equity price action, you had better look elsewhere. But, still, there are periods when the correlation seems to gain strength. If we take a look at the following chart, where the 120-day correlation between the S&P 500 and WTI oil is depicted for the period between 2000-2016, we can clearly identify a changing pattern. The correlation between WTI Oil and the S&P 500 changed dramatically in 2008.
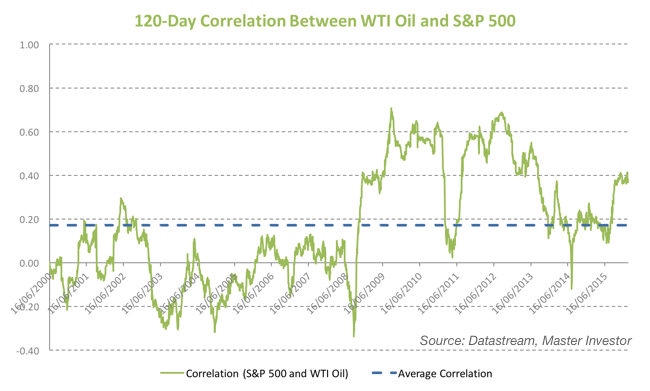
On September 3, 2008 the correlation between the S&P 500 and oil hit the lowest value of the millennium at -0.34. After that point the correlation rose dramatically, to +0.70 in September 2009. The rising correlation coincides with the period of the financial crisis where oil and stocks were both battered down. In the aftermath of the crisis the correlation remained high for some time but started decreasing again in 2013. A low at -0.12 was then hit on July 2014. More recently the correlation seems to be increasing again and it currently shows a reading of +0.38, which is feeding a renewed interest in the correlation.
If we split the data into two sub-groups, one running between January 1, 2000 and September 3, 2008 and the other between Sep 4, 2008 and February 3, 2016, we find that oil and equities aren’t always correlated. The average correlation between the two in the first period (the pre-crisis period) was -0.02. We can basically say that during the pre-crisis period equities and oil moved without connection. The average correlation in the second sub-group (the aftermath of the crisis period) shows a positive correlation at 0.39. While not being a huge correlation, it is certainly something, and we can then conclude that in the aftermath of the crisis equities and oil prices moved somewhat together.
It is very difficult to advance an exact explanation for the observed changing correlations. It’s tough to even explain the direction of any correlation. I have come across all sorts of explanations in the financial press, none of which is able to sufficiently explain the interaction.
On one hand, when oil prices are declining, production costs decrease. Usually oil is an important production factor, which exposes companies to any change in oil prices. If oil prices appreciate too much, companies need to pass the cost to the final consumer through rising prices. Rising oil prices would then generate inflation, contributing to a decrease in the real income of households, which would cut consumption expenditures. Faced with lower aggregate demand, companies cut production and investment. The final effect on GDP and employment levels is negative, and one would expect the equity market to react accordingly. This explains why oil prices and equity prices are negatively correlated.
But, there is another facet to the relationship. If there are many companies directly involved in oil extraction and production, an increase in oil prices increases their profits. These companies will hire and invest more, propagating a positive effect throughout the economy. Output and employment levels are then expected to rise. So, when oil is an important sector, a positive correlation between oil and equity prices is expected.
Only after mixing the two effects above we can understand how oil and equity prices are related. First of all, the share of each may vary with economic conditions, geographical location, and many other conditions. Second, even if oil and equities are related, a time lag may exist.
Consider the differences between oil-importing and oil-exporting countries. A recent study (2011) conducted by researchers from the University of Portsmouth looks at these correlation issues. The study uses data for the period between 1987 and 2009 for two groups of countries: oil-exporting (Canada, Mexico and Brazil) and oil-importing (USA, Germany and Netherlands). Against the conventional wisdom, the researchers find that the correlation between oil and equities is the same for oil-importing and oil-exporting countries. This would suggest that it doesn’t matter whether oil represents income or expenditure.
Potentially of more relevance is lagged correlation. Current changes in equity prices are better explained by previous changes in oil prices, with the correlation being negative for all markets. Another important point in the study is related to the type of oil shock under consideration. When the shock comes from demand, oil and equity prices both rise; when it comes from supply, oil rises while equity prices decrease. The explanation for this is very straightforward. A shock in demand is usually related with improving economic conditions and then associated with the business cycle, which should boost equity prices at the same time as oil prices rise. On the contrary, a shock in supply increases uncertainty and then creates volatility in the equity market, which impacts prices in the opposite direction.
A curiosity is the fact that the study finds a negative correlation between equity prices in the current month and oil prices in the previous month for all cases, except one:
“The only exception is the 2008 global financial crisis where the lagged oil prices exhibit a positive correlation with stock markets”.
I guess that when the FED replaces the market, we must also change our assumptions. We can no longer rely on free market adjustments, as the outcome is distorted by the central bank. With the central bank pushing equity prices higher when they were adjusting lower, I guess that the only correlation that matters is between equity prices and the money supply.
In the short term, I suspect that many are those who look for an oil price rise to start buying equities, while others look for an equity price rise to start buying oil. One justifies the other! In the long term, having oil and equities in a portfolio seems to provide a good diversification boost, in particular when the central bank is out of the investment equation.
Comments (0)