How to utilise a lazy (and disciplined) approach to spread betting
 approach to spread betting")
If you don’t want to be sat in front of a trading screen 24 hours a day, David Jones has a different spread betting approach that may be of interest.
There is a misconception that if you are spread betting and trading then you need to be stuck to the screen around the clock, watching every tiny fluctuation in the markets. But it doesn’t have to be this way and given the way financial markets are moving at the moment, this time around we are going to look at a low-stress approach to taking advantage of some of the swings.
It was the best of times, it was the worst of times
As I am sure you will have noticed, 2020 has been quite the year for financial markets. The coronavirus-inspired crash in March has seen an impressive recovery in many assets since then. In the past month, both the NASDAQ and gold have set all-time highs – and continued on to new highs. Any of us who decided to cash out and sit on the sidelines over the past few months has missed out on some impressive gains. And those who have never traded a stock before but downloaded an app and just threw some money at it in April are feeling like Warren Buffet or George Soros at the moment!
It is an odd, but fascinating time. One problem plenty of us have – and I am definitely no exception to this – is jumping on board a market that has already moved quite some distance. Let’s use gold as our example to illustrate the psychological hurdles here.
Gold price August 2018 to June 2020
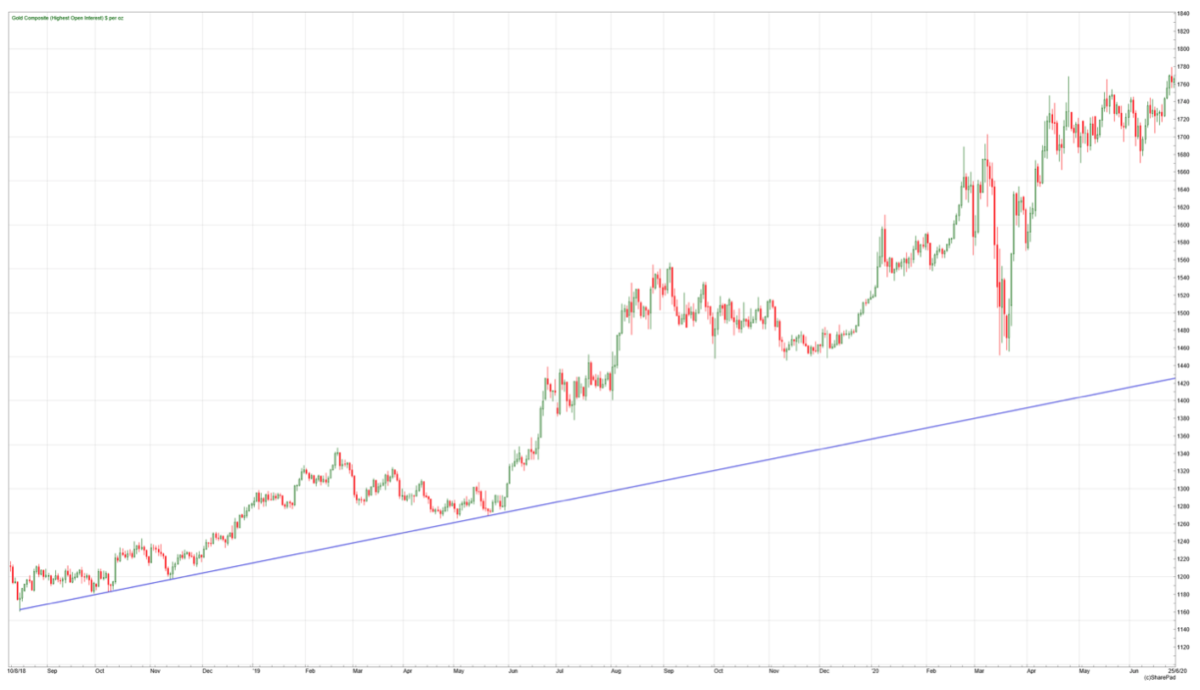
Like many markets, it has been a pretty volatile year for the yellow metal. It had been in a good trend from August 2018 where it was trading at $1,160 per ounce and had hit $1,700 by March of this year. During March, the price did plunge back to $1,450 before rebounding back above $1,700 – but it could not go much further in the short-term, surely? Let’s bring things up to date.
Gold price – August 2018 to present
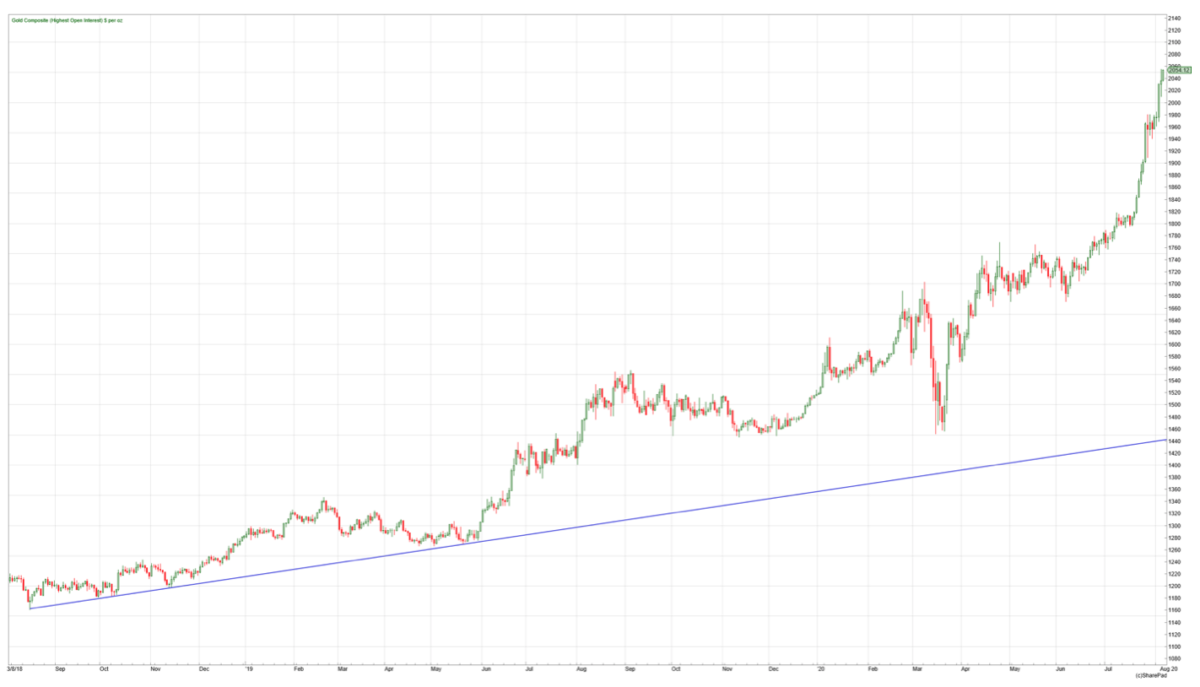
Since those late June levels around $1,760, the price of gold has risen another 15% in a little over a month – and so far at least, it is still rising. It is a great reminder of that old maxim: “markets can remain illogical longer than you can remain solvent”. This was aimed at people often betting on a currently strong rising market to fall, on the basis that it can’t go any higher. Selling short gold over the past few months would probably have been an expensive and painful exercise for anyone in that trade.
I think those charts do illustrate how psychologically difficult it can be to trade those sorts of moves if you are not already in the position. If you do have a trade open then checking the price becomes a pleasure – just watching the profits clock up every day! But it can be agonising if you are not in to sit on the sidelines, waiting for some sort of pullback that you convince yourself you will buy – but it never comes.
Using orders to automatically open a trade
This is where using orders when spread-betting can do some of the heavy lifting for you. There is potentially an opportunity in the US stock market to place an order at the moment, so here is a chart of the S&P 500 for the year so far.
S&P 500 – year to date
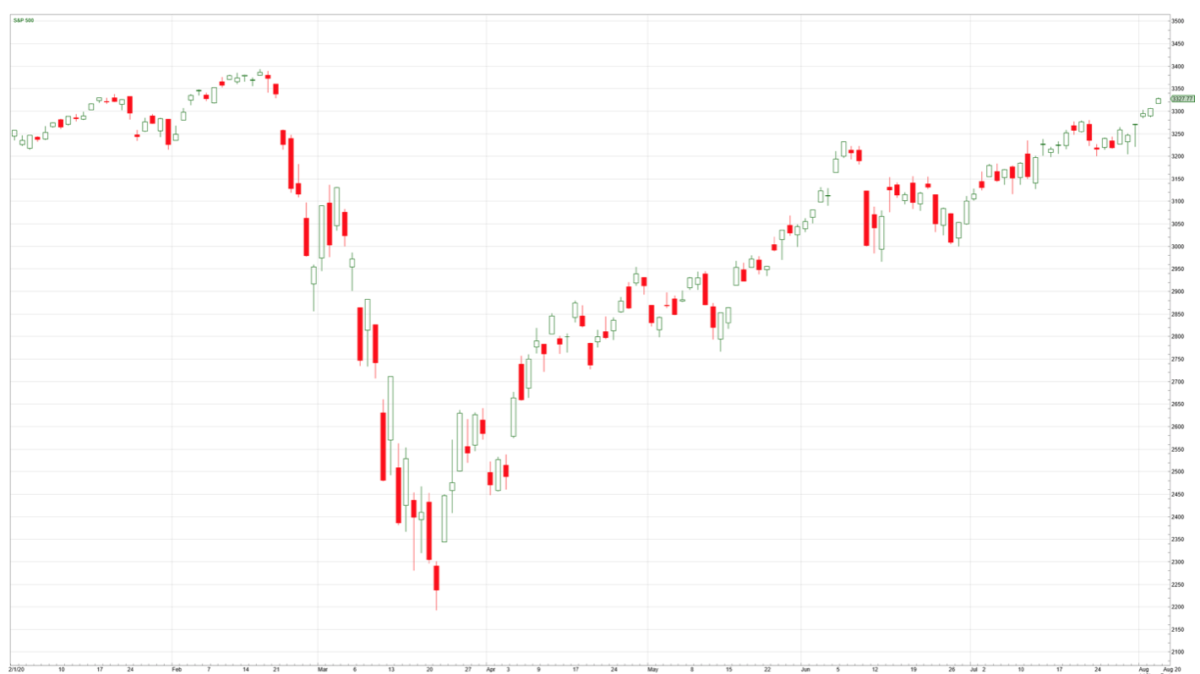
In common with other stock markets this broad US index has had quite the rollercoaster in 2020. Fresh all-time highs were set in February, but as fears of the Covid-19 pandemic spread, you can see the market clearly fell off a cliff into March. The S&P 500 index had lost about a third of its value by the third week of March, but the recovery since then has been just as impressive. At the time of writing going into August, the market has bounced back by just over 50 percent and still remains strong. However, what is interesting is the previous all-time high from February, just shy of that 3,400 level.
Basic technical analysis and charting tells us that previous highs and lows can be obstacles for markets – and I think the real test for the S&P over the next month or so is whether these 3,400 highs can be cracked. if the market does trade through 3,400, then this is a classic break-out. It can suggest that another new trend is starting and we may expect the market to move higher. If trading using this strategy, what we need to do is sit on our hands until and if that level gets broken. If the S&P 500 manages to break through 3,400, we may want to be a buyer – and this is where using spread bet orders can come in.
One approach could be to place an order to buy at, for example, 3,420. I’ve chosen 20 points above that previous level as a fairly arbitrary distance, but hopefully gives us enough room away from the level that we don’t get put into a new trade and end up just getting caught up in the noise. My view here is if the market manages to punch 20 points through that old high it does start to look like a valid break. Of course, we still need to think about risk management. At the same time that we set the order to buy at 3,420 we can also attach a stop-loss to that order – so if 3,420 gets filled then the stop-loss will be active at the same time.
If it ends up being a valid break – and there’s no way of knowing until after the fact – then we wouldn’t expect the market to sell off too deeply after the breakout. So, a potential stop loss in this example is to put it 100 points away, at 3320. This now helps with the risk management for the trade. If we are buying at 3420 with a stop loss at 3320 then the stop is 100 points away from our potential entry point. In this example if we only wanted to risk losing £1000 if we are wrong, then with 100 points stop loss we would trade £10 per point.
No magic systems
As usual it’s important to recognise this is no panacea – this is not a magic system that is going to be right all the time, on every trade set up. But it can be a way, as with the example of the move in gold, of getting into a trend that has a long way still to go. Let’s not forget that most people – at least 70% – lose money when it comes to trading. What we want to do is probably the opposite of what most people do when spread betting. Using this disciplined approach means we’re not watching the market hour–by–hour, chasing moves and getting chopped up in the day to day noise of a financial market. Rather, we are identifying potentially important levels and placing an order that will get executed if the market moves through that level. Of course, there will be losses along the way but the idea of a trend following breakout strategy such as this is that we catch a couple of trends that more than make up for a number of smaller losing trades.
I have used this for a while and palladium ended up being a big winner for me towards the end of 2019 and into early 2020.
Palladium Price – 2019 to February 2020
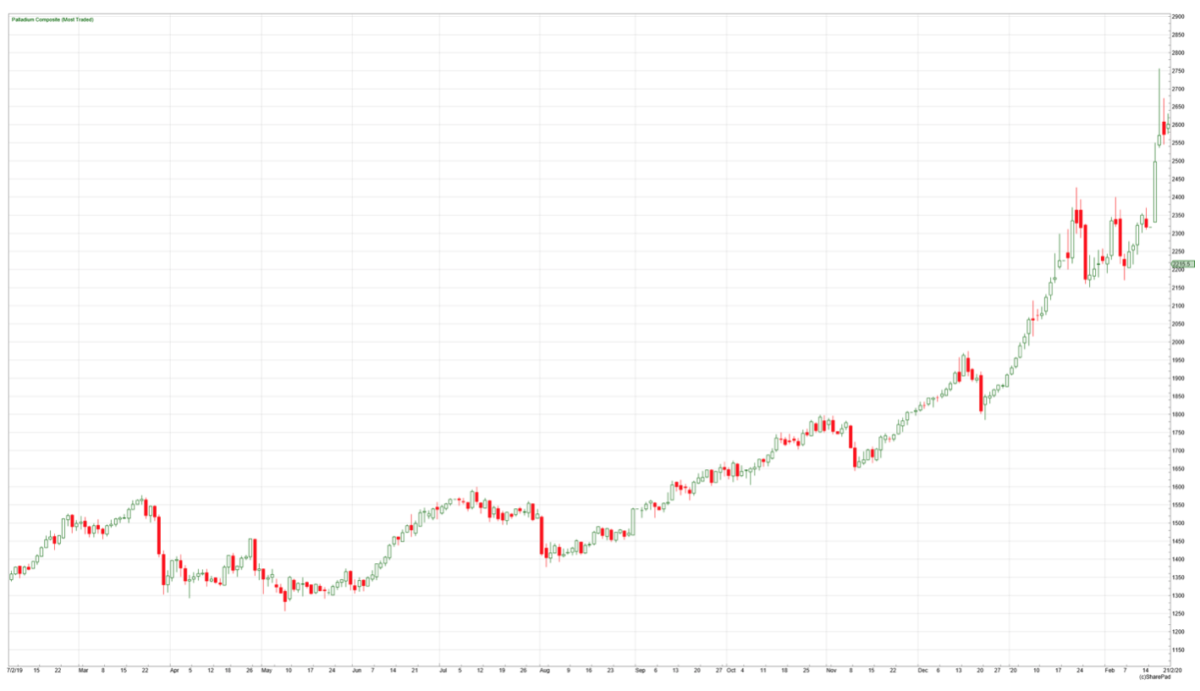
As with the gold movements in recent months, palladium was something of an even more extreme market (to say the least) in 2019 and coming into this year. But extreme moves do happen in markets – they can often move much further in either direction than any of us are expecting. This strategy is a way of trying to capitalise on these moves: limiting risk by using stop losses; and accepting there are going to be false breakouts along the way. But it only takes a few trends to really make a difference to your trading account over, for example, a 12-month period.
These set-ups do occur over different time periods – I chose the S&P500 as an example here due to the obvious all-time high to use as a reference point. But other markets are worthy of attention – here is the pound/US dollar exchange rate.
GBP/USD – October 2019 to present
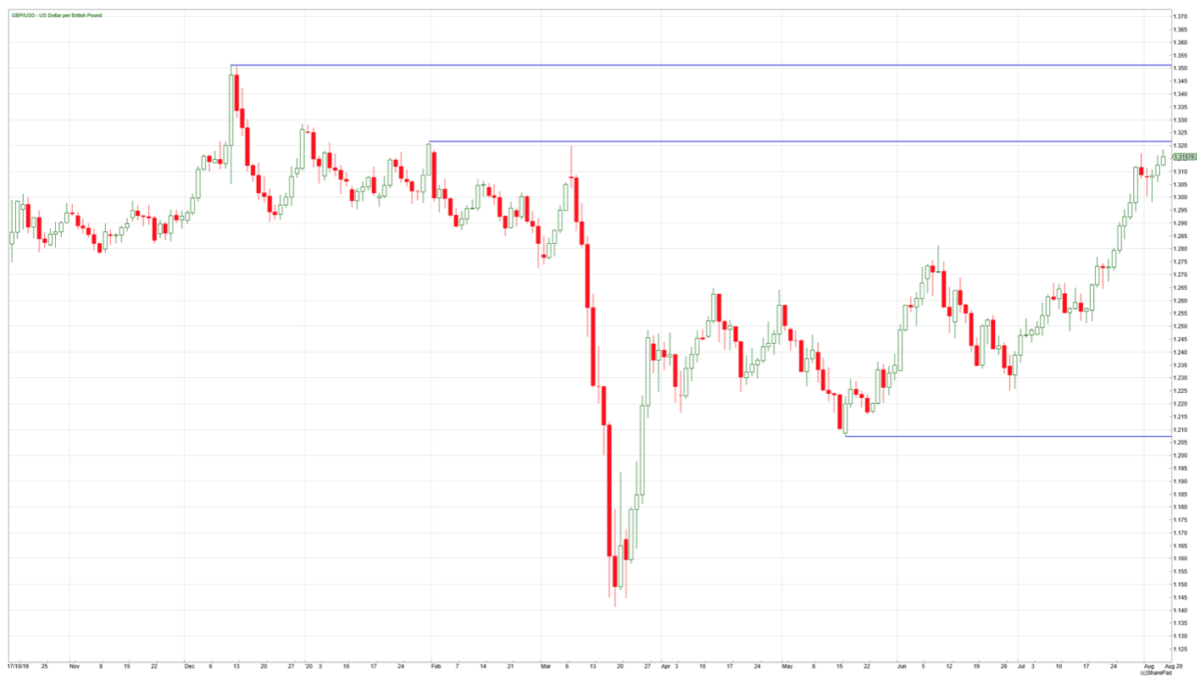
It can be seen that from December last year to early March 2020 the 1.32/1.35 area was a big hurdle for GBP/USD. I have no idea if 1.35 will be broken in the months to come – but setting up an order to buy if it does is a way of not missing out on a potential new trend – and taking away the requirement to watch the market all day, every day. For many of us, it is a much more disciplined and lower-stress way of trading.
Comments (0)