An automated approach for picking recovery shares – MAGAZINE EXCLUSIVEMAGAZINE EXCLUSIVE

MAGAZINE ARTICLE
This article first appeared in Issue 40 of Master Investor Magazine.
Click here to download the article as a printer-friendly PDF

Get this article and many more – for free! |
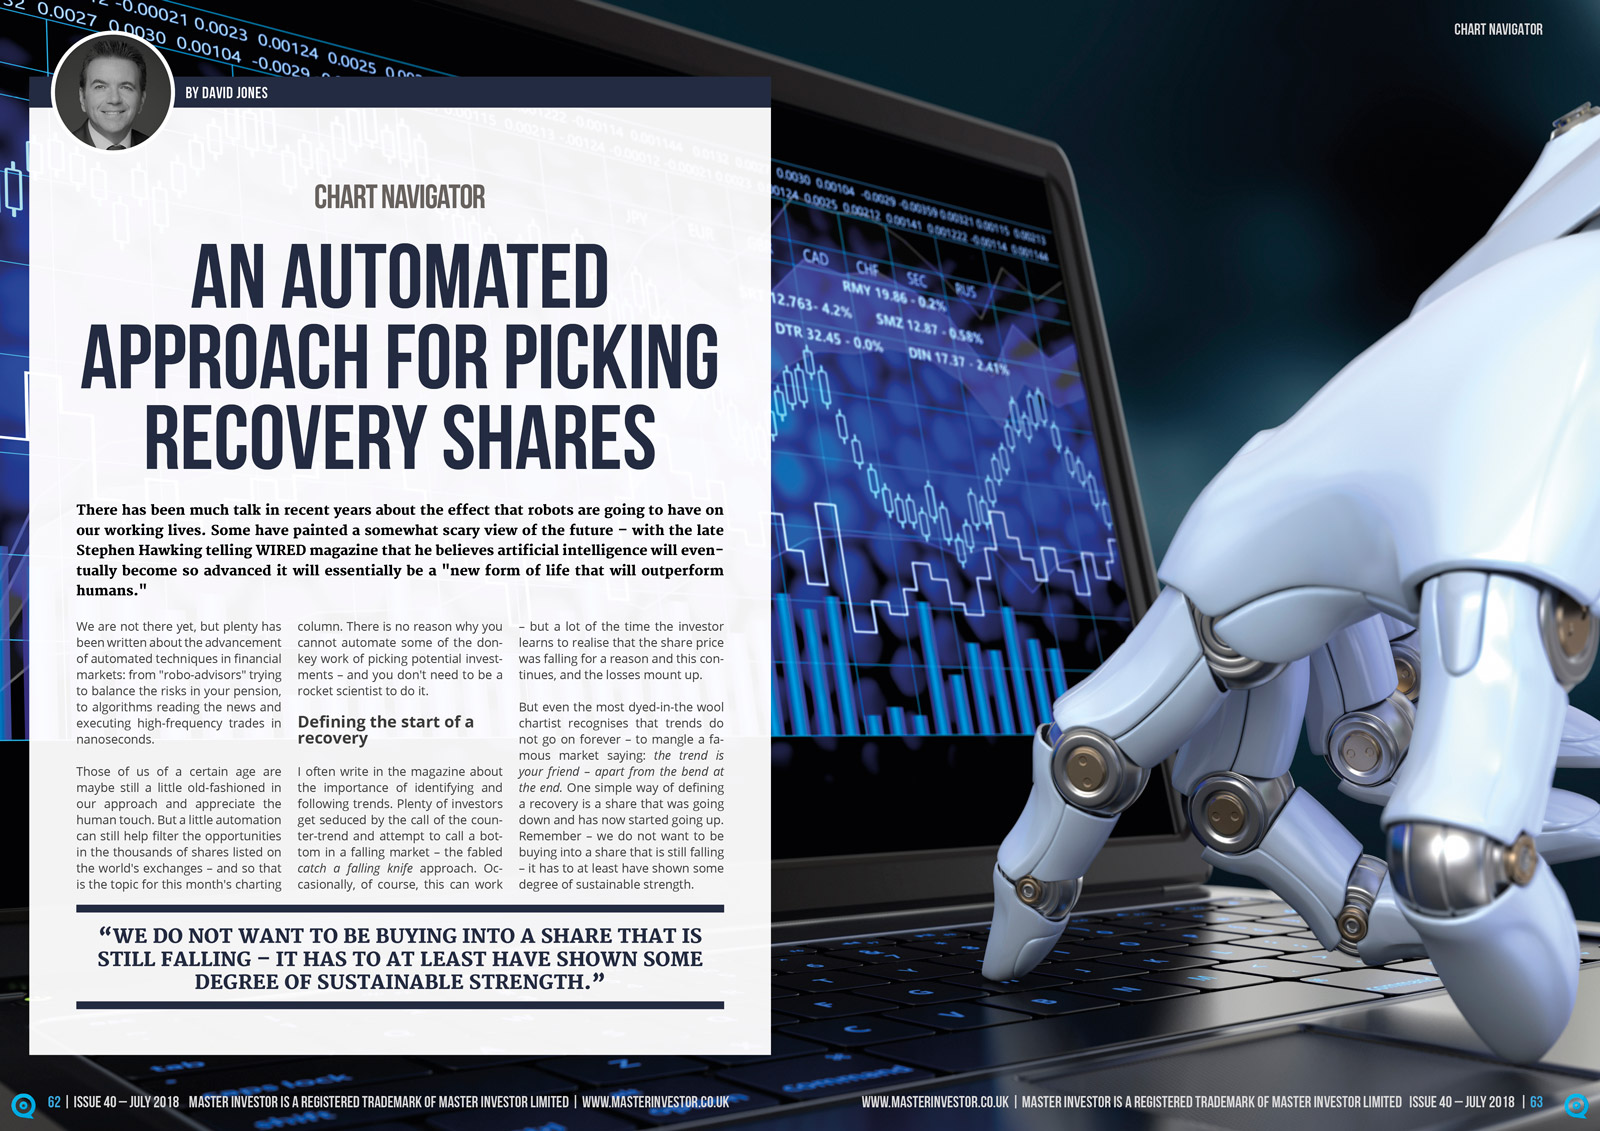
There has been much talk in recent years about the effect that robots are going to have on our working lives. Some have painted a somewhat scary view of the future – with the late Stephen Hawking telling WIRED magazine that he believes artificial intelligence will eventually become so advanced it will essentially be a “new form of life that will outperform humans.”
We are not there yet, but plenty has been written about the advancement of automated techniques in financial markets: from “robo-advisors” trying to balance the risks in your pension, to algorithms reading the news and executing high-frequency trades in nanoseconds.
Those of us of a certain age are maybe still a little old-fashioned in our approach and appreciate the human touch. But a little automation can still help filter the opportunities in the thousands of shares listed on the world’s exchanges – and so that is the topic for this month’s charting column. There is no reason why you cannot automate some of the donkey work of picking potential investments – and you don’t need to be a rocket scientist to do it.
Defining the start of a recovery
I often write in the magazine about the importance of identifying and following trends. Plenty of investors get seduced by the call of the counter-trend and attempt to call a bottom in a falling market – the fabled catch a falling knifeapproach. Occasionally, of course, this can work – but a lot of the time the investor learns to realise that the share price was falling for a reason and this continues, and the losses mount up.
But even the most dyed-in-the wool chartist recognises that trends do not go on forever – to mangle a famous market saying: the trend is your friend – apart from the bend at the end. One simple way of defining a recovery is a share that was going down and has now started going up. Remember – we do not want to be buying into a share that is still falling – it has to at least have shown some degree of sustainable strength.
The time periods used can be subjective – but as we are focussing on investing rather than trading, I tend to define significant weakness as a share price that has slid for a year. And the start of a recovery? If the price is currently higher than it was three months ago, we have the start of a more robotic approach to coming up with an investing shortlist that saves us the leg work of having to flip through many charts.
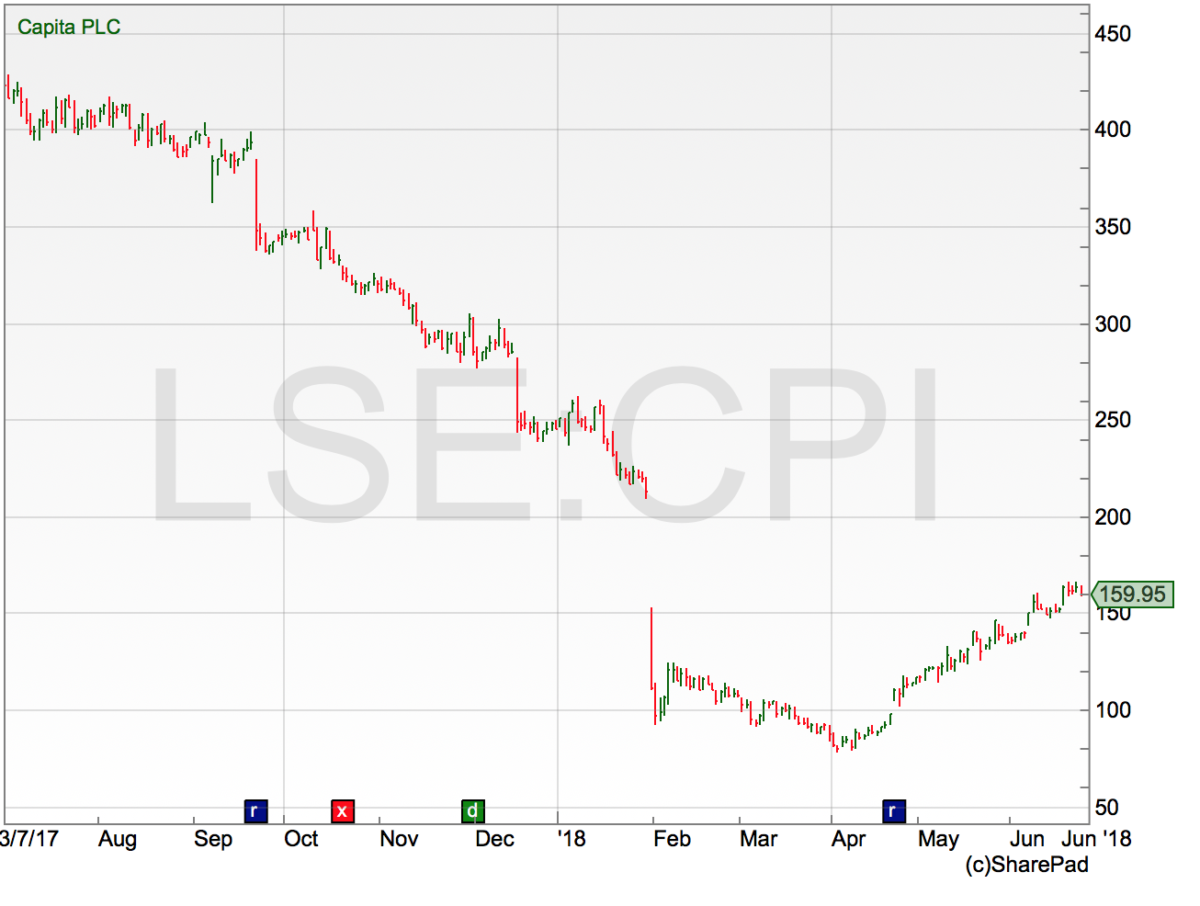
For this article I have used ShareScope’s software and based the list on the FTSE350. There were 97 companies that had fallen for the last year but risen over the last three months. From this list, the share that had gained the most over the previous three months was Capita (LON:CPI).
Managing the risk
On the face of it, this does fit our criteria – it has fallen really heavily but there has been something of a bounce back. In fact, this has been an incredibly strong recovery – the share price has doubled from its three-month low, and therein lies the problem for me from a risk point of view.
It is a question of managing the risk – stop losses are not just for traders and are still something I rigorously use on longer-term investments. If we are looking for a recovery play, we have to accept it may not go in our desired direction immediately. In fact, given the size of the decline and the strong bounce back, there could well be a high degree of “noise” – choppy trading. I do not want to get taken out in all of this chop, so the logical place for a stop-loss is below the three-month low. But in this example, that would mean I would end up losing 50% on the share if I get stopped out. So, it is time for another filter.
The earlier stages of recovery
To eliminate the shares that have recovered a little too far without me, another filter is applied. Again, this is a simple one – the share price must be no more than 20% above its three-month low. This way, the likes of Capita (that have admittedly done very well) get excluded. This brings the shortlist down slightly from 97 shares to 79. This represents a solid list of shares where the price action is suggesting that maybe the worst of the slide is behind the price, and a list such as this can throw up interesting looking charts such as Severn Trent (LON:SVT).
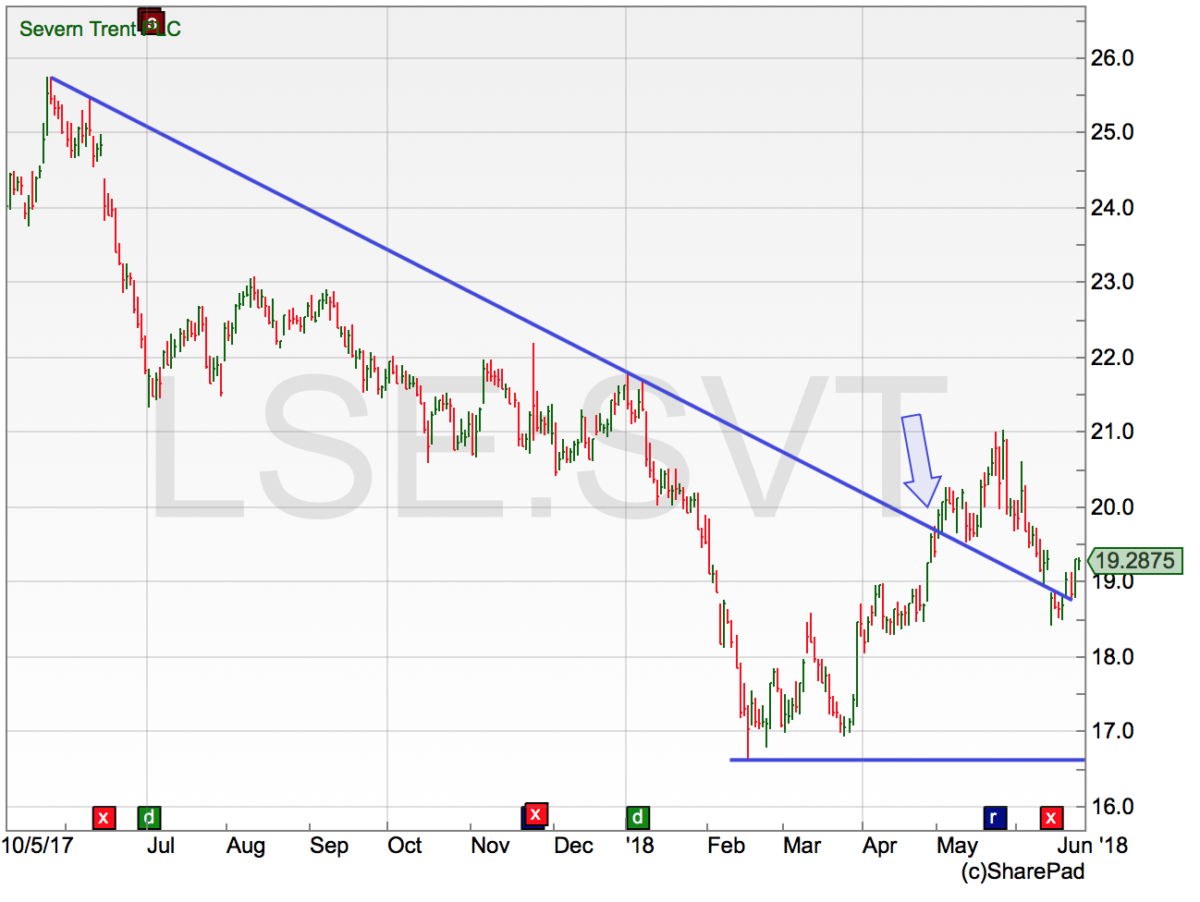
Clearly, it has not been the best 12 months for holders of Severn Trent, with the price sliding from above 2,500p per share to below 1,700p. But that strength seen over recent months has managed to break out of the trend line highlighted on the chart – often a suggestion that sentiment is shifting. Of course, just because a trend line breaks it does not mean a market is about to set off at a lightning pace in the direction of the new trend – there can often be the “chop”, as referred to above. This is what we have seen in Severn Trent. But a stop loss below those absolute lows from February at 1,645p is about 15% away from the current price, which is much more sensible when it comes to managing risk. If this is the start of a more longer-term recovery for the share price, then that major low really should not be broken. It gives a very obvious level to get out if things do not go to plan.
Recoveries often happen slower than you expect
Whilst we all wish our shares would start on an immediate recovery a few minutes after we buy them, this is, unfortunately, rarely the case. It can take some time for positive sentiment to come back. Another possible filter involves getting paid to hold the shares whilst waiting for them to claw their way back higher. This is some simple criteria based on the historical dividend yield for the share price – if it goes nowhere for a year, at least I can hopefully expect to see some income for having my money tied up. Applying the requirement of at least a 3% dividend yield to the list reduces the shares that meet the criteria to 50. Severn Trent still makes the cut, with a historical yield of more than 4% at the time of writing – and a quick scroll through the list can highlight interesting longer-term charts such as Imperial Brands (LON:IMB).
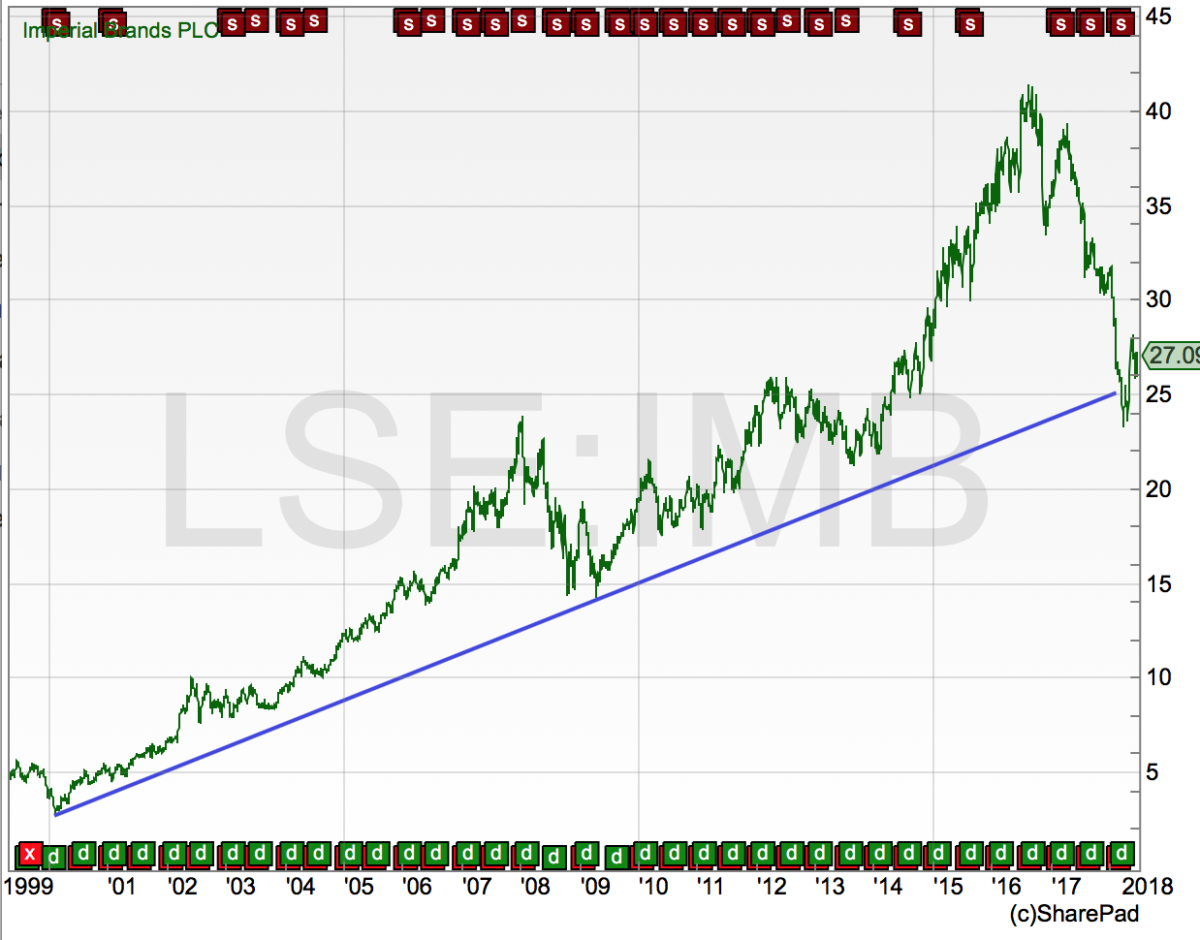
The share price has dropped by around 40% in less than two years. It has been negative over the last 12 months but has gained around 14% over the last three months and has an historical yield of over 6% at current prices. From a really long-term perspective this has had an incredible trend going back to the beginning of the year 2000. So, some chartists may view the recent run of weakness as bringing the share price back to its historical longer-term trend.
Automation – the future of investing?
“Probably not”, is the quick answer to that one! By the very fact you are reading this magazine it probably means that you are someone who still wants to be actively involved in their own investing decisions. But hopefully the approaches outlined here show that it is possible to blend both techniques – you do not have to have a strategy that is exclusively one thing or the other. A lot of the initial searching for a suitable investing short-list can be easily automated if you have definite criteria – leaving you with a much more manageable list of companies to examine in further detail without having to wade through many hundreds of price charts.
Chart of the month: IMI (LON:IMI)
For this month’s chart I have stuck with the criteria we have been examining throughout the article. Namely, a share price that has declined for the past 12 months, has moved higher over the past three months but no more than 20% above its low and with a historical dividend yield of at least 3%.
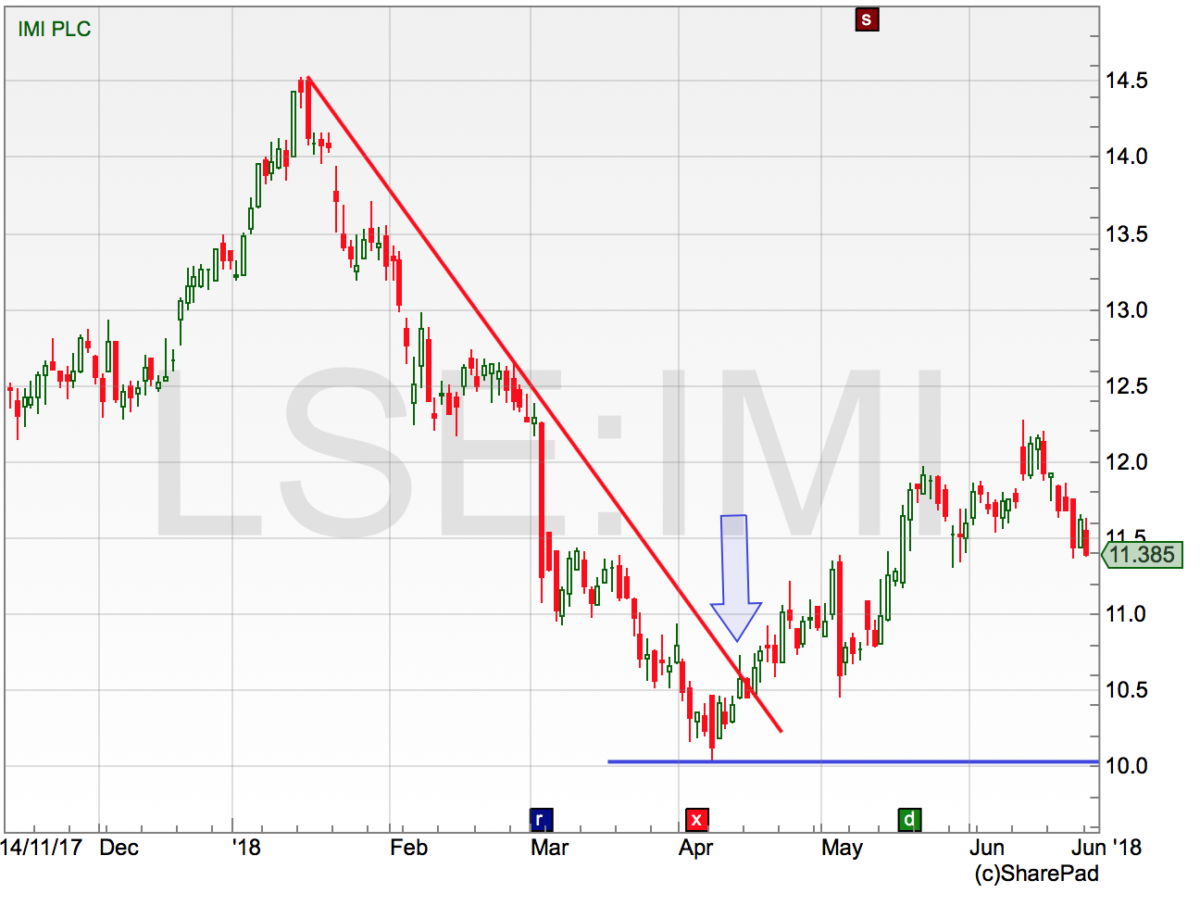
I liked this for a few reasons. First of all, that is a clear downtrend from the January 2018 high around 1,450p. This decline found support just ahead of 1,000p in April of this year and the subsequent rally broke the down trend. Since that April low, it has been trying to build a new uptrend. Over the past couple of weeks, the price has weakened – but no market moves in a straight line. If this is going to be the start of a recovery, then that old low at 1,000p should not be taken out. At the current price of 1,140p this gives a stop loss under 13%, which is an acceptable amount to risk when trying to catch the start of a much longer-term recovery. And finally, a dividend yield of 3.4% seems reasonable too.
|
Comments (0)