How to build a quality portfolio for rising volatility

In the light of a widely anticipated economic slowdown, Filipe R. Costa explains how quality factors can be used to manage an effective portfolio.
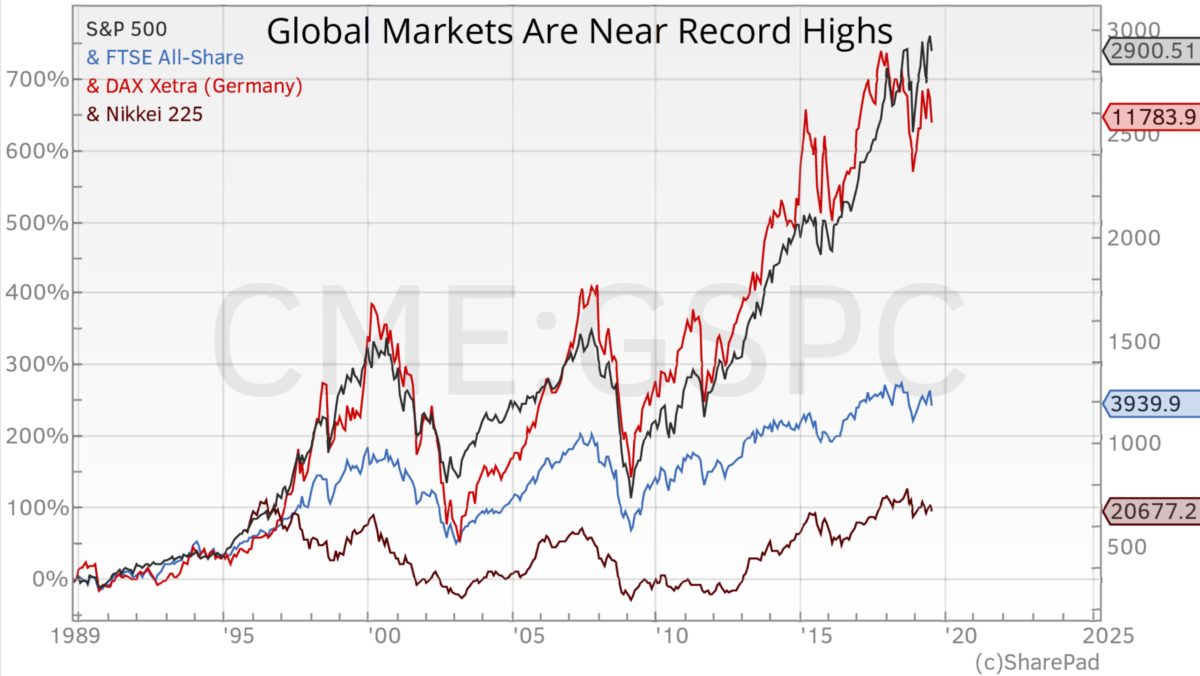
Is the 10-year market rally coming to an end? Do central banks around the world have the necessary tools to avoid a recession? At a time of rising volatility, investors must take action. But that doesn’t necessarily mean replacing bonds with stocks. Investors may instead increase exposure to quality .
The boom of the US equity market following the aftermath of the 2007-2009 financial crisis has been spectacular both in magnitude and duration. In 10 and a half years, the S&P 500 rose by 325%, rewarding investors with a compounded rate of 14.8% per year. The global economy recovered well and the US economy, in particular, experienced expansion, along with subdued inflation and record low unemployment. However, there are now signs which give cause for concern. For instance, the latest GDP figures point to contraction in Germany and the UK, and slowing growth in the US. This comes at a time when central bankers have limited conventional policy tools, with interest rates currently at 2.25%. Against this backdrop, questions are being asked as to the best way to manage an effective portfolio.
Should investors reduce exposure to equities while increasing exposure to bonds? The conventional view, in terms of portfolio management, is that it’s best to group assets into classes according to their risk-return characteristics. Bonds do well in recessions; equities do well in apositive economic environment.Thus, increasing bond exposure should improve returns and/or reduce risk when the economy is moving fromboomto bust. However, with interest rates so low at the moment, it’s hard to foresee further decreases in bond yields and therefore the upside potential for bonds seems limited.
What about investing in specific factors that do well in uncertain times? An unconventional approach to portfolio management is to divide assets according to different factors, ie characteristics, that are associated with higher returns. All we have to do is to identify the prevailing factors for volatile times and then, using accounting ratios, match them quantitatively.
The investment case
In my view, it’s not time to write off the equity market, but we need to be cautious, because there are hints of tougher times ahead. When the economy cools and sentiment turns from neutral to negative, turnover and profit estimates are slashed and equity prices decrease, with some stocks more exposed than others. Positive sentiment usually boosts the smaller, harder-to-value stocks, more than established companies. When sentiment is high, investors are attracted to stocks that show unstable cash flows and profits, high leverage and high growth potential. However, when sentiment changes, and money becomes more valuable, investors look for safety, offered by stable cash flows and profits, moderate leverage levels and reasonable growth prospects.
Profitability and quality are the key traits to look for in stocks at a time of rising volatility.The next step would be to match quality and profitability against accounting ratios that can proxy them. This is something an individual investor can do, with the help of a good stock screener.
To help individual investors build their own portfolios, I will now go through the process of selecting stocks on the basis of quality/profitability. For the ‘lazy’ investor, there’s an alternative way to get exposure to that factor, ie through exchange-traded funds (ETFs) that select investments based on certain rules (smart beta approach).
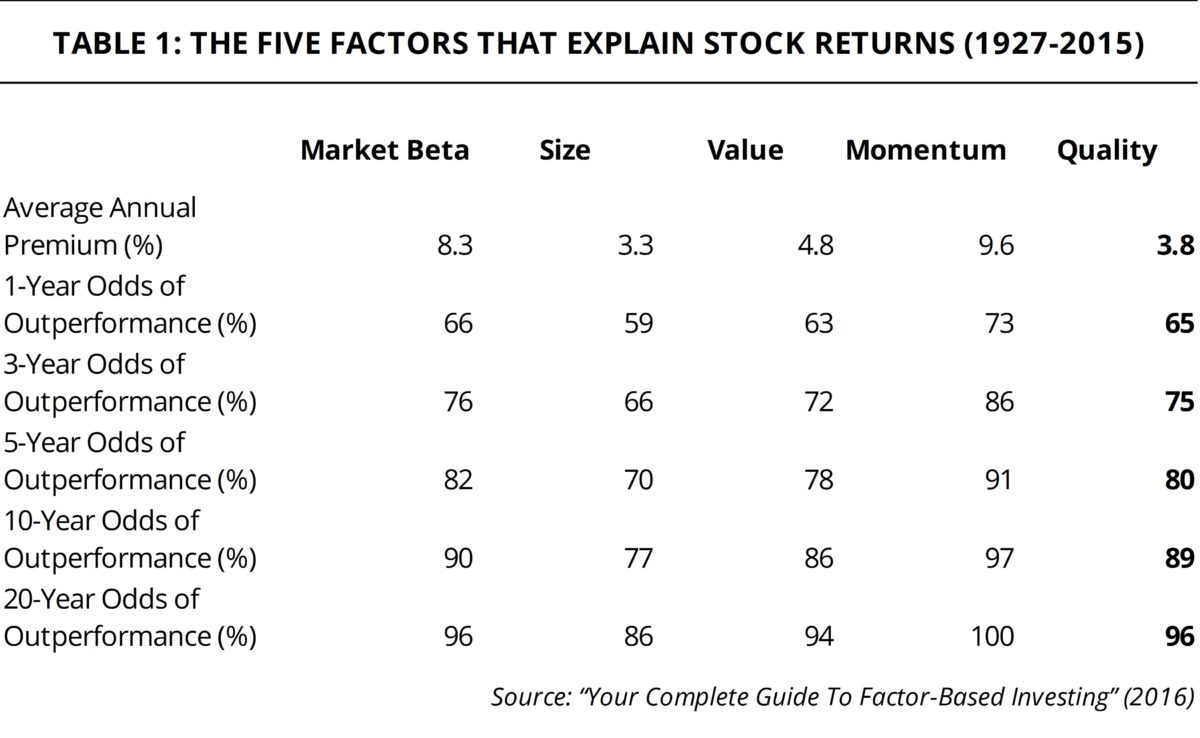
Equities can be broken down into five key factors
Market beta is the key factor for explaining asset returns. It expresses the degree to which an asset tends to move within the broad market. An asset with a higher market beta is a kind of leveraged market bet and it therefore comes with higher expected return and risk. The other key factors are size, value, momentum and quality/profitability.
The size factor captures the compensation for bearing the additional risk of investing in less-known, smaller companies; value captures the tendency for relatively cheap assets to outperform relatively expensive ones; and the momentum factor captures the reward for buying the best-performing assets while selling the worst-performing ones.
The profitability factor captures the outperformance of profitable firms that are less susceptible to negative macroeconomic conditions. In selecting these companies, investors earn a premium above the market return, which is particularly in demand at times of recessions and high volatility. In fact, quality is an extension of the profitability factor; it encompasses profitability as well as other characteristics that high-quality companies have, such as low profit volatility; high profit margins; high asset turnover; low financial and operating leverage; and low stock-specific risk.
The proxies for the quality factor
The big question about the quality factor is: how can we build the quality factor quantitatively?
We need to find a few simple accounting ratios that serve as proxies for quality. There is extensive academic literature on the accounting ratios to use; however, a key characteristics of the factors I mention above is their robustness to various measures. That means that, no matter the proxy used to target quality (provided it is reasonably related to that factor), the quality premium should be present. In a football game, a goal will always be a goal, no matter where you’re watching it from.
For the sake of capturing quality traits from a list of equities, I use the following proxies:
- Return on Capital Employed (ROCE) – ROCE measures profits before interest and taxes (EBIT), which I believe is the best measure of profits. Capital employed is also a better measure than assets or equity, because it measures the amount of capital from all sources. ROCE is more precise than return on assets (ROA) and return on equity (ROE). I use trailing 12-month figures here.
- Cash Return on Capital Employed (CROCI) – Good companies should have a consistent ability to earn high profits on the money invested, as measured by ROCE. However, some companies have difficulty in converting those profits into cash. Good companies should be able to produce lots of surplus free cash flow. CROCI is calculated by dividing free cash flow by capital employed. This ratio gives an idea of how good the company is at converting profit into cash and it’s much more difficult to ‘massage’ cashthan profits. Similar to ROCE, I use trailing 12-month figures.
- Debt-to-enterprise value – As leverage tends to be a problem during hard times, we prefer to focus on companies with sound balance sheets that can overcome bad times without taking on too much debt. The lower the debt-to -enterprise value the better. Similar to ROCE and CROCI, I use trailing 12-month figures here.
- Interest cover – Good companies should pay interest obligations with ease, which means being more than able to pay interest expenses. Quality companies have ratios of three, four or even more. This helps to assure investors that if the business cycle turns unfavourable, the company will still be able to pay interest without external financing or shareholders’ dilution. Trailing 12-month figures are again used here.
- EBIT growth volatility – Quality companies typically make consistent profits over time. It’s not about showing large profit growth rates but rather low growth volatility. Highly volatile profits are usually associated with nascent companies and with pro-cyclical businesses. To measure growth volatility, I compute the standard deviations of the last five annual EBIT per share growth rates.
We have five ways to proxy for quality. What we now need is to rank them effectively. Some investors/academics prefer to select stocks separately; others prefer to build an overall ranking. I prefer the latter option.
Let’s start by attributing a rating for each stock and for each proxy (the higher the rating, the better the quality factor). Each stock will therefore have five ratings, one for each quality factor. We sum up these ratings to obtain an overall, global rating for each stock, and then rank them, from high to low, by the overall rating. We may then decide to buy say the top 10 or top 20 ranked stocks, or perhaps buy the top-ranked stocks and sell the bottom stocks.
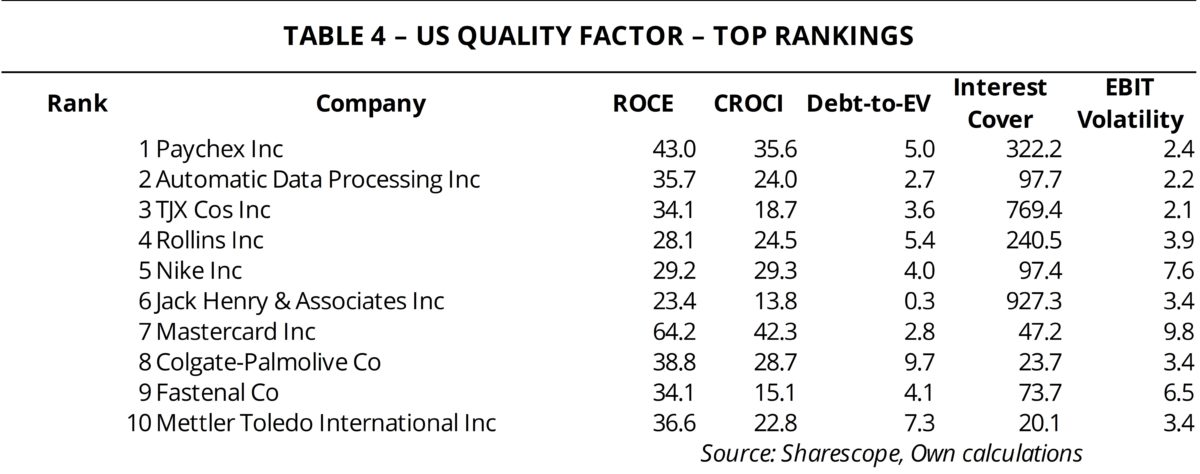
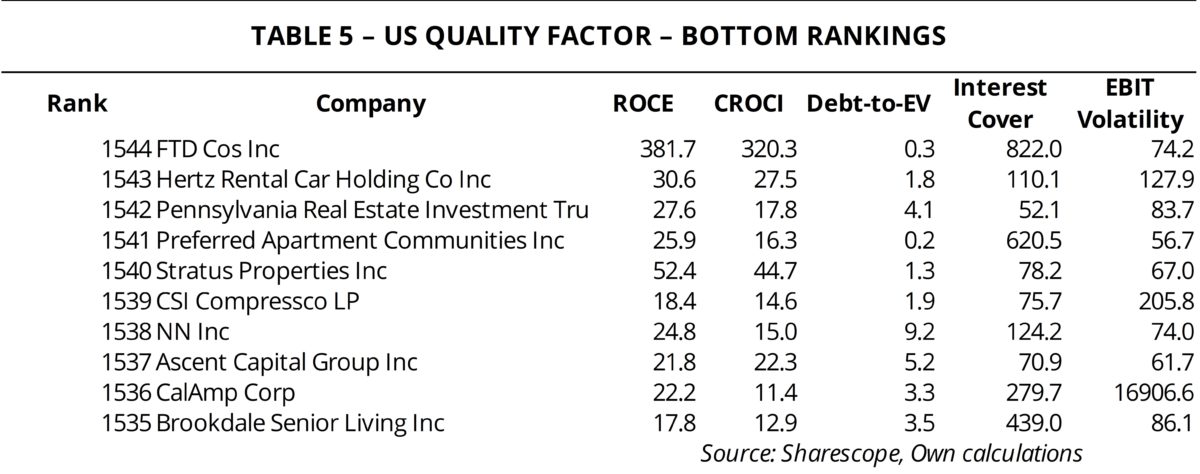
After collecting the data for the five ratios mentioned above for both a list of UK stocks and a list of US stocks, I obtained a shortlist of 414 UK stocks and 1,544 US stocks. Tables 2 through to 5 show the top and bottom selections for the UK and the US market (based on the calculated global ratings).
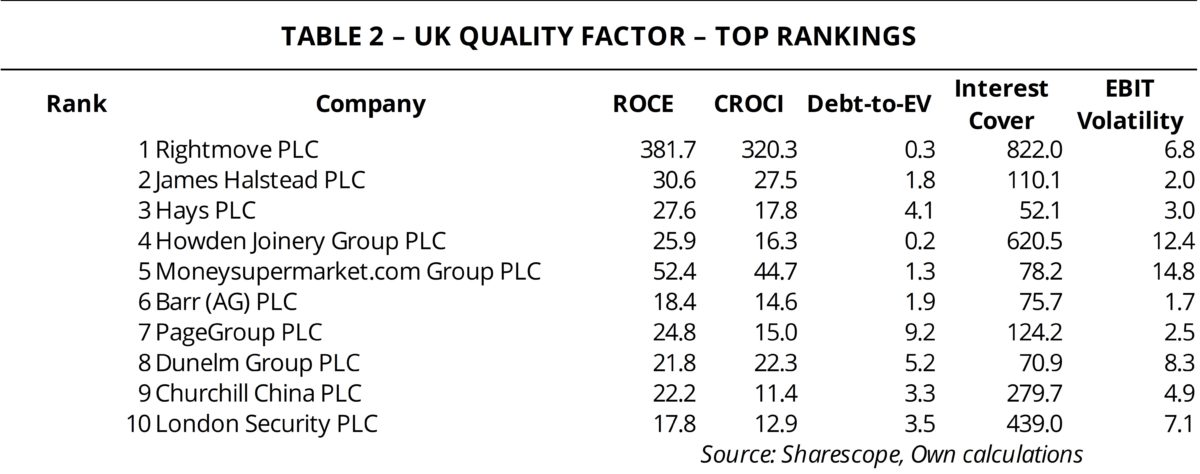
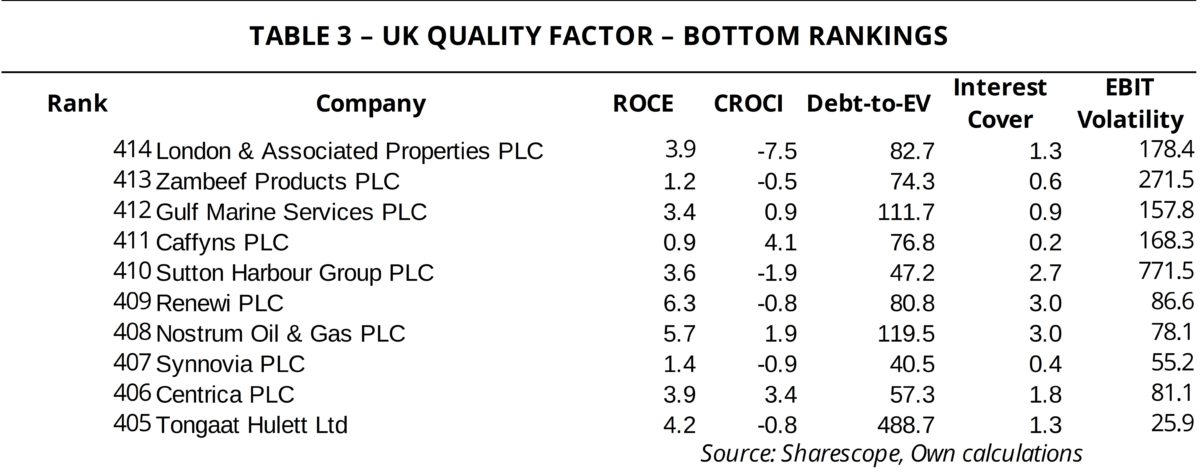
The top UK stocks for the quality factor include Rightmove (LON:RMV), James Halstead (LON:JHD), Hays (LON:HAS), Howden Joinery Group (LON:HWDN) and Moneysupermarket.com Group (LON:MONY). These top companies don’t rank high on every proxy, but they rank high overall. The bottom-placed stocks include London & Associated Poperties (LON:LAS), Zambeef Products (LON:ZAM), Gulf Marine Services (LON:GMS), Caffyns (LON:CFYN) and Sutton Harbour Group (LON:SUH).
The US list includes Paychex (NASDAQ:PAYX), Automatic Data Processing (NASDAQ:ADP), TJX (NYSE:TJX), Rollins (NYSE:ROL) and Nike (NYSE:NKE) at the top spots, and FTD (NASDAQ:FTD), Hertz Rental Car (NYSE:HTZ), Pennsylvania Real Estate (NYSE:PEI), Preferred Apartment Communities (NYSE:APTS) and Stratus (NASDAQ:STRS) at the bottom.
Factor investing usually consists of buying the top decile or deciles and selling those at the bottom. This strategy has the advantage of being market neutral. Unfortunately, from the point of view of an individual investor, this is often difficult to achieve and manage, because sometimes it is not even possible to short stocks, as the strategy may create additional risks, making it undesirable. Nevertheless, buying the top stocks from the list and building a long-only strategy can still provide exposure to the quality factor.
In terms of the exact number of stocks to buy, there’s no clear answer. I would say that 10 would be the absolute minimum to get exposure to the factor and enjoy some diversification. A better number would be something between 20 and 30, but that’s only doable if investors are able to spread their capital without incurring additional transaction costs. Such portfolios may be rebalanced semi-annually.
The easy option
- Vanguard US Quality Factor ETF (BATS:VFQY) – The ETF uses a rules-based quantitative model to evaluate US stocks. It’s diversified across market sectors, industry groups and different market capitalisations. The fund manages $22.2 million in assets, spread over 666 stocks. The expense ratio is 0.13%.
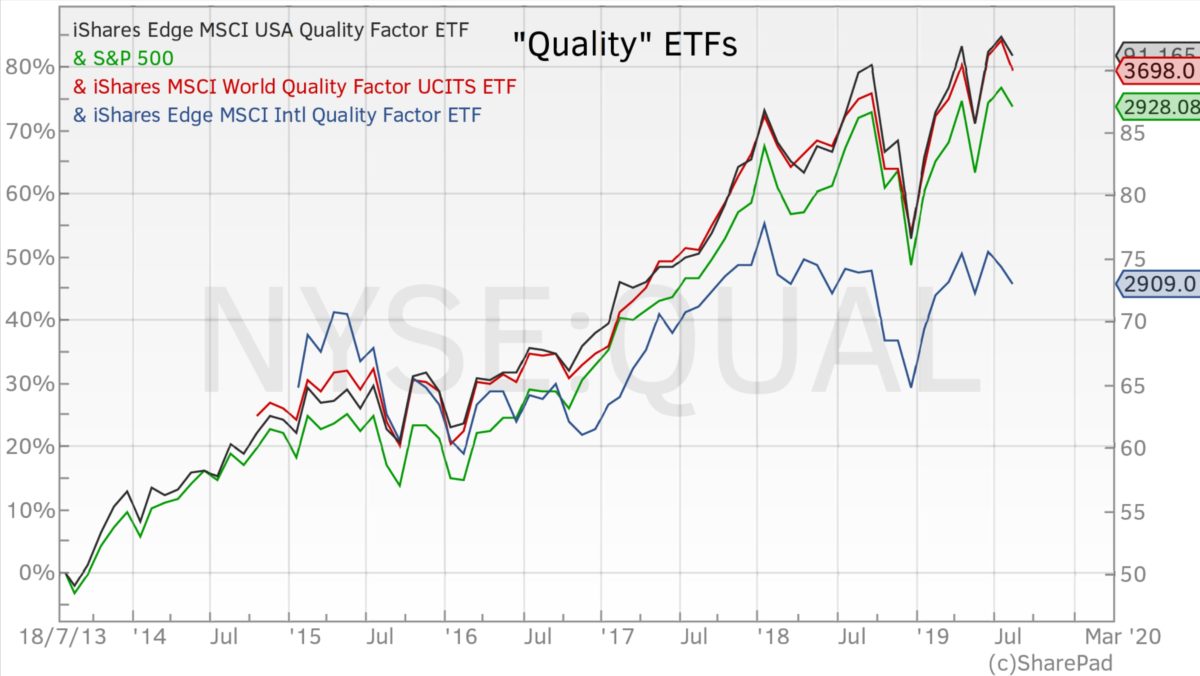
- iShares Edge MSCI World Quality Factor ETF (LON:IWQU) – The fund seeks to track performance of an index composed of a subset of MSCI World stocks with a focus on strong and stable earnings. The fund manages $1,559 million in assets, spread over 300 world stocks. Its expense ratio is a bit high at 0.30%.
- iShares Edge MSCI USA Quality Factor ETF (BATS:QUAL) – The fund gives exposure to large-and mid-cap US stocks with a focus on high ROE, stable earnings growth and low financial leverage. The fund’s total assets are $11,056 million and it is spread over 125 assets. Expense fees are reasonable at 0.15%.
- iShares Edge MSCI Intl Quality Factor ETF (NYSEARCA:IQLT) – This fund complements QUAL, extending coverage from the US to global markets. It manages $807 million in assets and comes with an expense ratio of 0.20%.
There are other options available, for different markets and from different providers.
Final remarks
At a time when economic growth is slowing and traditional monetary-policy tools are running out of steam, it’s worth considering a more conservative portfolio. However, despite what many people may think, being more conservative doesn’t mean increasing exposure to bonds and reducing exposure to stocks. The stock/bond proportion can be kept unchanged by increasing exposure to a factor that protects for downturns – the quality factor. Any individual investor can tilt their portfolio to the quality factor on their own with the help of a few accounting ratios and a good stock screener. For the investor who is looking for a shortcut, there are still a few good ways to gain exposure to the quality factor, in the form of ETFs.
Very interesting, what do you consider to be the best Stock Screeners Free/Subscription.
Regards