Three value traps to avoid

First seen in the April issue of Master Investor Magazine: John Kingham of UK Value Investor looks at three value traps and explains how he intends to avoid them in future.
2018 was a bumpy ride for most investors and I was no exception. The market price of my portfolio declined by more than 10% during the year, but that’s not really what I’m talking about. When I talk about a bumpy ride, I mean bumpy in terms of the performance of the companies I’m invested in rather than the performance of their shares. And in that regard, 2018 was too bumpy for my liking.
Don’t get me wrong; I’m not saying 2018 was a complete disaster, but it was bad enough to make me take a step back and review my investments and my investment process from the ground up. What I found was that several of my holdings could be classed as value traps, and there were three classes of trap. For each class of value trap, I came up with a fix so that I wouldn’t invest in that sort of situation in future, and this month I’d like to focus on these three types of value trap and my related fixes.
Value trap 1: Companies with large recurring ‘exceptional’ costs
| First seen in Master Investor Magazine
Never miss an issue of Master Investor Magazine – sign-up now for free! |
Since 2011 I’ve been reviewing companies using adjusted earnings (as well as much else besides, such as dividends, revenues and so on). The idea was that adjusted earnings provide a clearer view of a company’s ‘core’ business results, and to some extent that’s true. Adjusted earnings focus on the core business by removing one-off ‘exceptional’ income or expense items. These tend to be things like one-off gains on the sale of a business unit or one-off expenses due to tax or regulatory changes.
If you want to know how a company performed in any single year, then I still think focusing on adjusted earnings and ignoring exceptional items is the way to go. But if you want to know how a company has performed over the long term (and that’s exactly what long-term dividend investors should want to know), then reported rather than adjusted earnings are the ones to focus on. That’s because reported earnings include all those one-off exceptional income and expense items, and over the long-term those items can really start to add up.
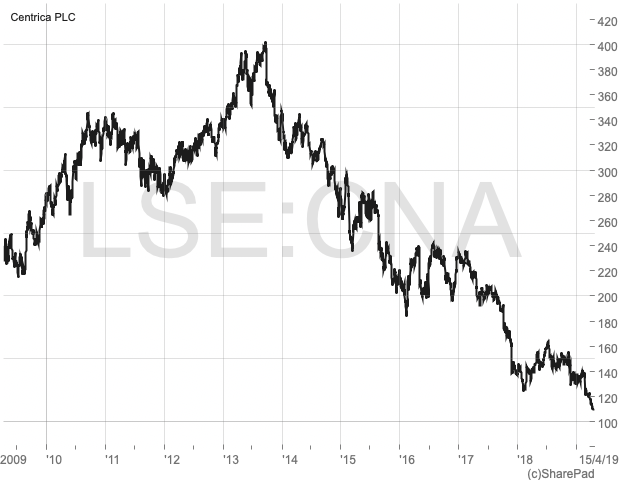
For example, I recently sold Centrica (LON:CAN) because it no longer fits my evolving investment criteria. One of the things that didn’t fit was the consistently large gap between reported and adjusted earnings (in practice, I use normalised earnings, which are a standardised version of adjusted earnings available from a variety of data providers, but here I’ll refer to them as adjusted earnings as they’re basically the same thing).
I bought Centrica in 2012 and at the time it had total ten-year adjusted net profits of £8.8 billion. Given that level of earnings, I thought the company was attractively priced. However, its total ten-year reported net profits came to just £6.5 billion, meaning the adjusted profits were some 35% higher than reported profits. If I’d looked at reported instead of adjusted earnings, I would have demanded a significantly lower entry price in order to offset those lower earnings. And if I’d invested at a lower price, my losses from Centrica would have been far smaller.
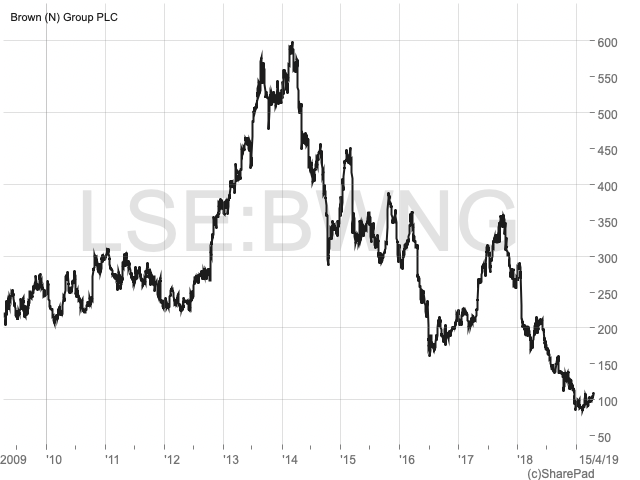
Another example is N Brown (LON:BWNG), the size 20+ and age 50+ fashion retailer, which I’ve owned for several years. N Brown recently cut its dividend which, if you only look at adjusted earnings, was a bit of a surprise. Adjusted earnings have covered N Brown’s dividend every year in recent years, with adjusted dividend cover over the last five years averaging 1.7. However, looking at reported earnings shows that over the last five years reported dividend cover has averaged just 1.2. More importantly, the dividend was barely covered by reported earnings in 2017 and was nowhere near covered in 2018. So, as with Centrica, reported earnings provided a much more realistic picture of N Brown’s performance (or lack thereof), rather than the rose-tinted best-case scenario view given by adjusted earnings.
Fix: Look at reported rather than adjusted earnings to get a better picture of a company’s actual long-term performance.
Another reason for looking at adjusted earnings is that they tend to be smoother and less volatile than reported earnings. Reported earnings include all those annoyingly large one-off exceptional items that can lead to profits which are up by 50% one year and down by 30% the next. That makes it much harder to measure a company’s long-term progress. Adjusted earnings, in contrast, tend to be far smoother, and that makes it much easier to measure a company’s growth over ten years, which is the timescale I usually focus on.
That’s why, historically, I’ve used adjusted earnings in my ten-year growth rate calculation, along with revenues and dividends. And so, having just ditched adjusted earnings in favour of reported earnings, I needed to update my growth rate metric. But simply swapping adjusted earnings for reported earnings wouldn’t work because the volatility of reported earnings would frequently mess up the growth rate calculation and give misleading results.
For example, if a company’s reported earnings were 10p ten years ago and 5p last year, has the company grown or shrunk? The answer is that you have no idea; perhaps earnings will be 25p next year and this year’s 5p result was due to a one-off exceptional expense. That’s why reported earnings are too volatile to be a useful measure of growth, even over ten years.
For my growth rate metric, I needed to replace adjusted earnings with something that would, in most cases, follow the growth of the company’s intrinsic value and earnings power (i.e. its ability to produce earnings rather than its actual earnings in any given year).
I went back to basics and thought about companies in terms of their fundamental inputs and outputs. Money comes into a company from customers as revenues and goes out to shareholders as dividends, which is why I was already measuring revenue and dividend growth on a per share basis. But money also comes into companies in the form of shareholder and debtholder capital. Capital from shareholders comes from rights issues and retaining earnings, while capital from debtholders comes from bonds or loans of one kind or another.
In simple terms, capital is used to buy productive assets that are then then used to supply products or services which attract revenues from customers. So, one way to look at a company is as a black box which takes in money from shareholders and debtholders (as capital employed) and money from customers (as revenues) and pays out dividends to (or buys back shares from) shareholders.
Or if you don’t like black boxes, think of capital employed as the engine of a company, revenues as the fuel going in and dividends as the horsepower coming out. As an investor what you want over time is a bigger engine, sucking in more fuel, producing more horsepower.
| Master Investor Magazine
Never miss an issue of Master Investor Magazine – sign-up now for free! |
As well as being a fundamental feature of companies, capital employed is also a relatively stable number and that makes its true growth rate far easier to measure. Overall then, I thought it made much more sense to measure capital employed growth rather than reported (or even adjusted) earnings growth, in theory at least. In practice, across the 30 or so companies in my portfolio, there is a good correlation between capital employed growth and each company’s overall progress in terms of revenue growth, dividend growth and so on.
Of course, no financial metric or ratio has perfect foresight, but I’m confident that capital employed growth is worth paying attention to:
Fix: Instead of measuring earnings growth, measure capital employed growth along with revenue and dividend growth (all on a per share basis) to measure a company’s long-term progress.
Having said all that, it’s no good having capital employed growth which doesn’t eventually result in earnings growth, so you still need to measure earnings. But I prefer to do that indirectly by looking at things like dividend cover and profitability; speaking of which:
Value trap 2) Companies with wafer thin profit margins
What I’ve finally come to realise is that some companies are like carbon fibre: they’re strong but fragile at the same time.They can outperform peers and produce excellent returns for shareholders when the environment is benign, but when the going gets tough they fail catastrophically.
I experienced this years ago when I lost money on Balfour Beatty (LON:BBY) and Serco (LON:SRP), both of which were performing well but then suffered dramatic declines. More recently, companies like Mitie (LON:MTO) (which I own), Carillion and now Interserve (LON:IRV) (which I don’t own) have all suffered dramatic declines.
The thread that ties all these companies together, apart from excessive amounts of debt, is their thin profit margins, relatively fixed costs and their need to win large contracts with large customers. This is a toxic mix if ever there was one.
Companies like Interserve need to win large contracts with large customers, and because the contract is large and expensive the customer is usually very cost and quality conscious. That makes perfect sense: When you buy a can of coke you probably buy it with barely a moment’s thought, but if you’re selecting a contractor to fulfil a multi-million-pound contract, you’re going to take a lot of proposals and take a lot of time to do a lot of due diligence. From the supplier’s point of view, large contracts can produce big profits and lots of excitement and prestige. The result is a super-competitive landscape of highly aware buyers and highly motivated suppliers.
In fact, the landscape for these large contracts is so competitive that some companies will bid for contracts at a price so low they know it won’t make any money. They do this because it can be better to win a big contract and make no profit but at least be able to pay staff and retain them, than to not win a big contract and have to either keep paying staff and lose lots of money doing so or not pay staff and lose lots of staff (and then have to pay lots of money recruiting new staff when you do finally win another big contract).
This creates an environment where somebody somewhere is always willing to take on a contract with little or no profit margin, and that makes it incredibly difficult for even the best companies to generate reasonable returns.
The last straw for these companies is their relatively fixed and often unpredictable costs, or perhaps I should say their tendency to be overoptimistic on costs. For example, if you put in a bid to build an office block, you don’t actually know exactly how much it will cost to build that office block. But the customer only wants to pay a fixed £10 million, and you think you should be able to build it for £9 million, leaving you with £1 million profit. But things don’t go to plan (do they ever?) and it eventually costs you £11 million to build the office block. Congratulations, you just spent huge amounts of time and energy earning yourself a net loss of £1 million.
| Master Investor Magazine
Never miss an issue of Master Investor Magazine – sign-up now for free! |
This optimism on cost is driven by a focus on volume over value; on winning contracts per se rather than winning contracts which are very likely to be highly profitable. It’s a common flaw in peoples’ thinking, which you can see just from the fact that it’s called ‘winning’ a contract. If people thought about signing a contract as taking on a massive amount of risk and responsibility instead of ‘winning’, then perhaps they’d be more careful about which contracts they try to ‘win’.
In most cases, companies with these structural problems have very thin profit margins, so an easy way to rule them out is with a rule on profit margins:
Fix: Only invest in companies where the ten-year average net profit margin is above 5%.
You might think 5% is still quite a thin margin, and you’d be right. But I like to keep new criteria quite loose, and then tighten them up over time if need be. In this case, I think 5% is thin enough to allow me to invest in a wide variety of companies, but thick enough to rule out basket case companies like Carillion and Interserve (and Centrica as well).
Value trap 3) Business transformations
The last type of value trap I found myself in last year was business transformations. What do I mean by ‘transformation’? What I don’t mean is a company which is just trying to improve its general performance or recover from a brief stumble. I call those turnarounds and recovery situations respectively, and in those cases the company is basically staying in the same business while trying to do a better job.
A transformation is different. It’s more like a caterpillar turning into a butterfly. The scale of changes is on another level entirely. Either a) the core product or service changes completely, or b) the business model changes completely, or c) pretty much everything changes. You see this most often in companies where the core market is in long-term decline. N Brown, which I mentioned earlier, is a good example.
N Brown, the size 20+ and age 50+ fashion retailer, used to be a dominant force in the mail order catalogue business. People would sit at home and browse through a huge catalogue of niche fashion items and be able to order, receive and return goods without ever having to visit a shop.
For decades it was an excellent business model, but then came the internet, a computer in every home and rapid local delivery and return services. What was once a niche market (providing a way for people to shop, receive and return goods from home) became ubiquitous and N Brown must now compete against just about every clothing company with a website, which is all of them.
Transformations are incredibly hard.N Brown has recently cut its dividend, replaced its CEO and is now fully focused on a 100% mobile internet future. And while N Brown may yet survive and even thrive, it’s going to be a very long, difficult and risky journey. Absent a miracle, the return on my N Brown shares is unlikely to ever be satisfactory (which in my book means an annualised return of 10% or more).
| Master Investor Magazine
Never miss an issue of Master Investor Magazine – sign-up now for free! |
For an even more dramatic example, look at Connect Group (LON:CNCT) (which I don’t own), the dominant leader in the UK newspaper distribution market. As with N Brown, Connect’s core market is in long-term decline. To create a brighter future for itself, Connect has been acquiring companies in vaguely related growing markets such as parcel delivery (N Brown’s strategy has been to organically migrate key brands from catalogue to web). In my experience, the combination of a declining core market and the acquisition of companies in areas where the acquirer has little experience is, to put it bluntly, another highly toxic mix.
Regardless of the details, I am no longer willing to buy into business transformations. That’s because, more often than not, they’re a good way for investors to permanently lose money.
Fix: Don’t invest in business transformations where the core product, service or business model is in rapid permanent decline.
A slightly less clear-cut situation exists when a company’s core business is in very slow decline. This applies, for example, to businesses operating in fossil fuel sectors and tobacco. Both these markets are likely (in my opinion) to decline rather than grow over the next decade or two, but that still leaves quite a bit of time before these businesses are forced to radically transform or die. In the meantime, it’s possible that good returns can be had, so for me companies undergoing this sort of slow transformation may still be investible, but caution is definitely required.
Comments (0)