Price/Earnings Ratios Point to an Undervalued Europe

Since peaking last year, in the aftermath of Covid-19, stock markets around the world have been declining. A mix of high-flying and persistent inflation, rising interest rates and increased odds for a global recession has turned markets upside down and reverted most of the gains stocks accumulated after bottoming in March 2020.
The 2020-2021 recovery placed stocks on stretched valuations − technology stocks in particular. But, after a decline of 23% year-to-date, the S&P 500 offers some opportunities, especially in certain sectors. However, it is not in the US that the best opportunities lie but in Europe. While macro conditions in Europe are not favourable, markets are mostly undervalued. Many are trading at price/earnings (PE) ratios below 10x, offering long-term opportunities for investors. This is the case for Austria, Germany, Greece, Italy and Norway.
In March 2020, at the peak of the pandemic, PE ratios for the US, UK and European markets stood at 18.7x, 13.2x and 12.6x, respectively. The quick recovery the market experienced thereafter pushed these ratios to 31.3x, 22.4x and 21.4x in June 2021.
However, a mix of unfavourable conditions contributed to a new price slump and those ratios were battered down to 18.6x, 14.1x and 11.5x. The current numbers are similar to those observed during the peak of the pandemic. The PE ratios currently sit at 9.5x, 8.4x, 7.3x, 6.2x and 3.4x for Germany, Norway, Italy, Austria and Greece, respectively, as measured using Thomson Reuters Datastream country indexes.
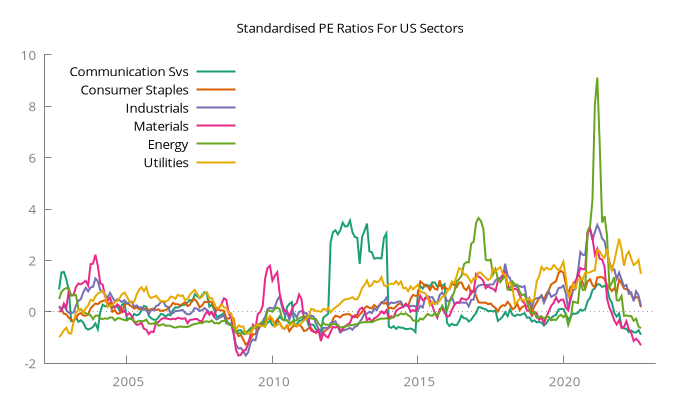
These numbers represent some good value opportunities for investors willing to accumulate stocks for long-term performance. The current crisis is certainly far from over, but it won’t last forever and stock prices are already reflecting recession-induced discounts. In terms of US sectors, communication services, materials and energy are trading at the lowest price ratios.
Measuring PE in relative terms
Not all indexes and industries are equal. The PE ratio for tech stocks is usually much higher than for utilities. At the country level, their ratios are also widely different. For example, over the last 40 years, the average PE ratios for the US, UK and Japan have been 18x, 15x and 34x, respectively. It is difficult to compare these numbers in absolute terms, though, as they reflect very different markets, each with its own characteristics.
One way to overcome the problem is by looking at these numbers in relative terms. If we standardise the numbers, we obtain a better measure that gives an idea of where a market is placed. The standardisation of the PE ratio involves subtracting the mean and dividing it by the standard deviation. The PE ratios have mean zero and unit standard deviation. It is then easy to interpret the meaning. A number around zero is neutral, a large positive number indicates overvaluation and a large negative number points towards undervaluation.
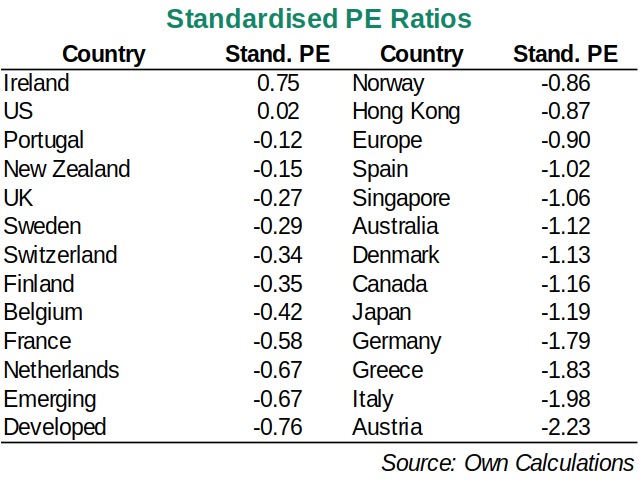
My data shows some significant negative numbers for Austria (-2.28), Italy (-1.98), Greece (-1.83) and Germany (-1.78). These markets are trading at low PE in historical terms. Even though Austrian equities are currently trading 23% above March 2020 levels, they look undervalued, because profits are rising faster.
[insert four-countries]
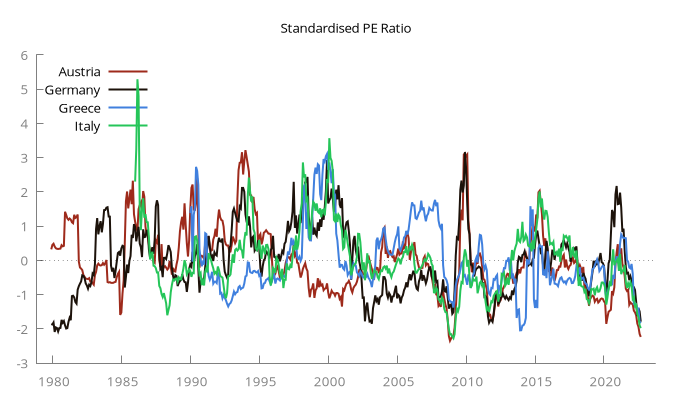
In Italy, the political instability that resulted in a far-right party winning the general election is contributing to the market downtrend. The last time that it traded below the current PE of 7.3x was during the global financial crisis (GFC). In Germany, the situation is similar. The current PE of 9.5x is higher than for other markets but still very low in historical terms. In March 2020, the PE ratio was 11.7x and the lowest value observed over the last 40 years was 9.4x during the sovereign-debt crisis in 2011 (and in 2003). In Greece, the current PE stands at 3.4x, the lowest PE from my data in absolute terms and close to the numbers observed in the country during its 2014 sovereign-debt crisis. But the current turmoil is by no means near what the country went through then.
While economic conditions are deteriorating in Europe, they are far better than those experienced during the GFC and the sovereign-debt crisis. The job market is on a much better footing and the European Central Bank currently has a lot more leeway for action, to avoid a country default. From a value standpoint, I believe that Austrian, Italian, Greek and German equities are interesting. Prices are discounting a deep crisis and long-term investors have an opportunity here.
Equities from the four aforementioned countries are top of my list, but undervaluation is currently present around the globe with few exceptions. European countries and Japan appear among the most undervalued countries. Australia and Hong Kong are also offering value opportunities. However, Ireland appears overvalued and countries like the US, Portugal, New Zealand and the UK are neutral. The PE ratios in the US and the UK currently show record figures of 18.6x and 14.1x, which are clearly above PE ratios for most European countries. In standardised terms, these ratios are converted into 0.02 and -0.27, which are neutral readings.
Looking at US sectors, the standardised PE measure selects materials, communication services and energy as the most undervalued sectors, currently running with negative values. On the overvaluation side lie utilities, industrials and consumer staples. On this list, materials and utilities both show a number higher than one standard deviation (in absolute terms), but at opposing ends of valuation.
Putting it all together
The current market correction is not over because inflation is still running at very high levels around the world, forcing central banks to continue on a path of increasing interest rates. These higher rates come at an unfavourable time because of the war in Ukraine and the energy crisis that is unfolding.
However, some markets are trading cheaply in historical terms, in particular within Europe. Austria, Italy, Greece and Germany offer investors very good opportunities from a long-term investment standpoint. Japanese and Australian equities are also trading at cheap prices. This opportunity is not reflected in the UK and the US, where PE ratios appear neutral.
Despite the price corrections observed over the last months, equities from these countries were pushed too high with stretched valuations and may drop even further. To capture value in US equities, investors need to select parts of the market like stocks in the materials, communication services and energy sectors, which offer the best value. Utilities, a traditional defensive sector, has already been pushed too far and offers no value.
Investors looking for ways to invest in the above countries and sectors have several options in the ETF world. Some suggestions for investing in Austria, Germany, Italy and Greece include iShares MSCI Austria (NYSEARCA:EWO), Global X DAX Germany (NASDAQ:DAX), iShares MSCI Italy (NYSEARCA:EWI) and Global X MSCI Greece (NYSEARCA:GREK). For a US sector tilt, my suggestion is the Vanguard Materials (NYSEARCA:VAW), energy (NYSEARCA:VDE) and communication-services (NYSEARCA:VOX) ETFs. There are many other options in the market but these are good in terms of diversification and fees charged.
This is all very true but they will be cheaper in a months time.