Selecting Small Cap Value

Investors are talking about a possible market rotation. In my last blog Will There Be A Market Rotation I discussed this topic. My view is that there is a gap for small caps to fill, but I don’t expect a strong rally for small caps relative to large caps. However, economic conditions could turn favourable for smaller stocks, and then picking the best value out of these stocks could be a sound strategy. With this in mind, I have set up a quantitative strategy based on six metrics aimed at picking the most solid stocks from the small-cap universe. Here is my strategy.
Market capitalisation
My target is small-cap stocks, so I’m looking for something between $250 million and $2,000 million. There’s no exact definition and you can adapt it to your goals and the market you’re looking at. For example, you could take the median capitalisation of the market as a maximum and then define a minimum just to be sure to avoid illiquid stocks.
Enterprise value to EBIT (EV/EBIT)
This ratio helps identify companies that are potentially undervalued on the basis of their operating profits. This is my preferred alternative to the P/E ratio, which replaces equity for enterprise value and looks at operating profits rather than bottom line profits. The reason for this preference is that operating profits (here in the form of EBIT) are much less manageable than net profit. In addition, looking at the whole company, including equity and debt, reduces the impact of debt structure and leverage in valuing a company. A very good ratio would be something below 10, with something between 10 and 20 being generally acceptable. At this point I select stocks with EV/EBIT <= 20.
Return on capital employed (ROCE)
I need to know what a company is doing with the cash it has invested in the business. Usually, return on equity is highly dependent on leverage and this is the main reason why I prefer ROCE instead. We should look at the whole source of capital, whether it comes from shareholders or debt holders, otherwise the ratio would look very good for companies that make money from debt. The problem is that when economic conditions deteriorate, these companies are likely to go bankrupt. A good ROCE would be something above 15%. But again, I’m just picking what’s reasonable, and that’s something above 5%. I then pick stocks with ROCE >= 5%.
Cash Return on Capital Employed (CROCI)
To ensure that a company can convert its earnings into real cash, we can use CROCI, which measures cash flow from operations as a proportion of capital employed. A high CROCI indicates that the company can generate substantial cash flows relative to the capital invested in the business, reflecting capital efficiency. In general, a ratio above 10% is considered strong. However, following the same reasoning as for the other ratios, I select stocks with a CROCI >= 5%, which is acceptable.
Interest coverage (EBIT/interest expense)
At a time when the FED is expected to lower interest rates, companies with a higher debt burden should benefit the most. Therefore, a company with a lower financial health could rise more than the market if the FED implements monetary easing. However, all of this is a probability. I don’t want to pick companies that are not in a reasonable financial position to service their debt. The interest coverage ratio measures EBIT against interest expense. I select stocks with an interest cover >= 3.
Performance relative to index
We may have the best value strategy ever devised. But timing is everything. We want to pick stocks that have been out of favour, as opposed to stocks that are out of favour. At the same time, we want to avoid stocks that have risen too much in the last 21 days (more or less one calendar month), as they may be more exposed to price corrections. To avoid both situations, I select stocks whose performance relative to the country index over the last 21 trading days is >= -10% and <= 15%.
Final selections
I haven’t been very restrictive in using the above ratios because I just wanted to get a pre-selection of what I think is reasonable and investable. I reserve the right to pick the best for now. This is because if we use very restrictive criteria to select stocks, we usually end up with a very short list. At the same time, value is a relative concept that changes with market fundamentals. I want to invest in the best of the available options, not the optimal. It’s a pragmatic rather than a theoretical view.
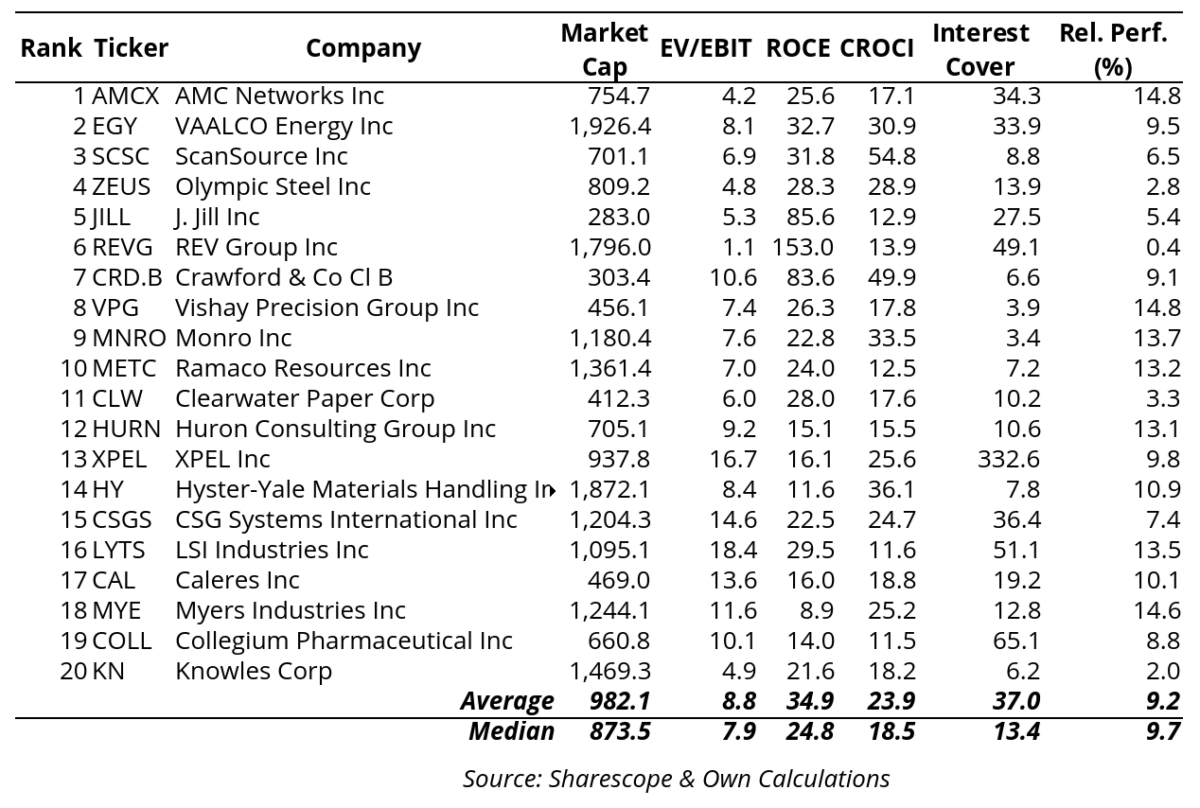
The next step is to rank the shortlisted stocks I have identified above. I have 78 stocks in my list. I sort the stocks by: 1) EV/EBIT, 2) ROCE, 3) CROCI, 4) Interest Cover, 5) Relative Performance, from best to worst. For EV/EBIT, this means that the top stock is the one with the lowest value. For all other ratios, it is the opposite, and the top-ranked stock has the highest value. For each of the five sorts, I start by giving the highest score to the top stock (in this case, 78), then 77 to the next, and so on. I repeat this process until I have points for all five metrics.
Now that I have a score for each metric, I add up all the scores for each stock to get an overall score. The final step is to rank all the stocks from highest to lowest score. I selected 20 stocks, which I show in the table below.
This is a blind strategy that selects stocks based on a set of filters. The advantage is that we can structure an approach to stock selection and improve it over time. It doesn’t depend on gut feelings and is a systematic and sound way of investing. The disadvantage is that we can sometimes end up with some odd selections. Finally, it is a good idea to look at each stock in the ranking for a number of reasons. For example, there may be a concentration in a single industry.
Comments (0)