Are valuations now dangerously stretched?

Stretched Valuations
Since the beginning of the year, I have been drawing the attention of the reader to the lack of volatility in U.S. markets, as such a high level of complacency is extreme by historical standards and is not supported by current fundamentals. Recently, the VIX (INDEXCBOE:VIX) fell below 10, which is a rare occurrence. While no one knows exactly where the floor is, with the VIX following a mean reverting process, and with its historical mean being around 18-19, the only sensible bet would be to go long volatility.
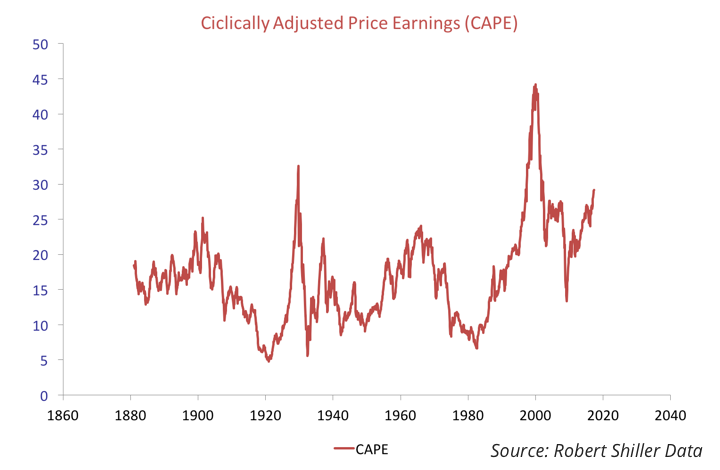
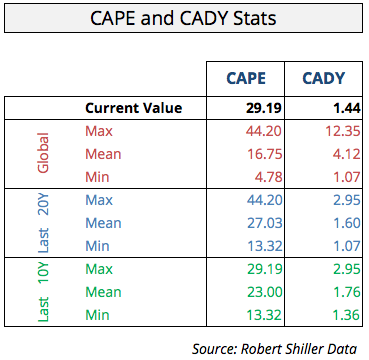
But, it is not only volatility that has been showing a huge level of complacency; valuation indicators are also stretched. The Cyclically-Adjusted Price-Earnings ratio (CAPE), developed by Robert Schiller, is also on the rise and currently pointing to figures last seen in 2001. The CAPE ratio is near 30x, having risen 8.6% since Trump was elected in November. At the peak of the financial crisis, this ratio was reading a level of 13.3x (March 2009), but due to a mix of economic recovery, ultra-loose monetary policy, and massive optimism, the ratio was pushed to levels well above those obtaining before the financial crisis.

Robert Shiller’s CAPE index covers the period starting in 1881 until today. The mean for the ratio during this entire period is 16.75x. For the last 20 years the mean has been 27.03x (tilted higher by the Nasdaq bubble) and for the last 10 years it has been 23.00x. The current value is still above the mean for any of these sub-periods and may therefore indicate some degree of overvaluation.
Many believe the CAPE ratio is flawed. Of course it is: every indicator is. The best measure would be to take price on forward earnings, and not on past earnings. But, forward earnings are still influenced by cyclicalities and by analysts’ views. Thus, such an indicator is flawed too. At least the assumptions behind the CAPE are reasonable, in particular because it is calculated for an entire market. The P/E of some stock may change substantially – if the company makes some important upgrade on its products or earns some important contract, for example – but it’s hard to believe that kind of improvement could happen at the market level, and then justify a significant rise in market P/E. At the same time the P/E ratios should be mean reverting, because otherwise a company/market would have to show exponential growth, which is never the case. At times of substantial change, it’s understandable that P/E ratios increase, but as improvements are digested, those ratios should mean-revert. At this point, it’s difficult to justify a rapidly rising CAPE ratio, because economic prospects in general aren’t that good. Certainly the Trump reflation trade has something to do with it. But if that trade fails…
Cyclically Adjusted Dividend Yield
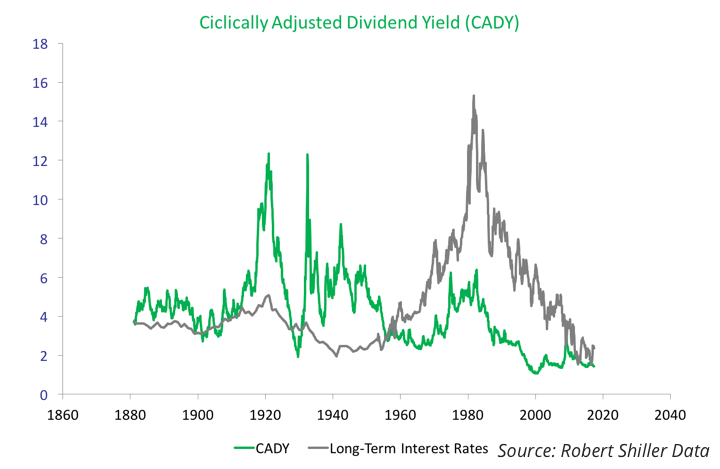
Another perspective that can be accessed using Schiller’s data is to look at dividends instead of earnings. Let’s build some cyclically-adjusted dividend yield data in a similar fashion Shiller builds CAPE and call it CADY. This ratio is the average real dividends paid during the last 10 years divided by current S&P 500 price.

The CADY is near lows, currently showing a reading of 1.44%, but so are interest rates. Long-term interest rates in the U.S. have been decreasing continually since the 1980s (in part due to the success of central banks in fighting inflation). But share prices have also been rising quite rapidly, battering dividend yields down. With these yields currently near historical lows, and price-to-earnings ratios too stretched, I would interpret the current CADY reading as negative for stocks.
Interestingly, and as a side note, we are witnessing a process where dividend yields are moving above Treasury yields. Until 1958, dividend yields were greater than Treasury yields, but the opposite was true for the next 60 years. In the early 1980s, the gap widened to the most negative ever (dividend yields much lower than Treasury yields), but then started shortening. It seems we are returning to the pre-1958 period. If that is the case, then prices will have to decrease or the dollar amount of paid dividends increase.

Waiting for Trump
Investors around the world are now more optimistic than they were on average during the period that followed the financial crisis. They have reasons for that, as fundamentals have improved substantially. Europe, for example, has been showing some positive GDP and employment improvements, while the U.S. is at near-record low levels of unemployment. At the same time, reported earnings for the first quarter have been good so far, justifying a rise in equity prices. But still, since Trump was elected, the S&P 500, the Dow Industrials and the Nasdaq 100, are up 10.2%, 12.4%, and 16.1% respectively. Earnings alone may not be enough to justify the upswing, and P/E ratios are increasing quickly. For these price levels to be supported, expectations going way into the future must be really good. And that is concerning, because the latest developments in U.S. politics are far from good. The dollar, for example, has already given up all its gains since Trump was elected; the euro is engaged in a huge uptrend against the dollar; and Treasuries continue to rise, despite the threats of the FED to hike rates and normalise its balance sheet. These are some early signs that not everything is well. The negative sentiment may soon spread to the equity market.
Trump has always been very vocal and bold in terms of his promises, but his actions are lagging far behind. He will unlikely be able to revert Obamacare, to implement a significant tax revision, or to spend billions in infrastructure. Support from Senate for such a revolution is limited.
At this point, Trump seems more concerned with fighting the media and the intelligence services, than with introducing significant changes to the economy. The demise of the FBI Director, at a time when the bureau was investigating the alleged interference of the Russian government in the U.S. election and alleged links between the Trump campaign and Moscow, may be interpreted as an attempt by the President to be above the law. The abrupt demise of James Comey came after Trump asked the FBI director to abandon his investigation of national security advisor Michael Flynn. The president was quoted saying to Comey:
“I hope you can see your way clear to letting this go, to letting Flynn go… He is a good guy. I hope you can let this go.”
The White House claimed the quote to be “not a truthful or accurate portrayal of the conversation between the president and Mr. Comey”. That may be true. But, with Trump meeting with Russian officials a few days ago and being accused of sharing highly classified intelligence with them, supposedly revealing the details of an ISIS plot and breaching the trust of an unnamed ally that gathered the information, it’s becoming harder to argue Trump’s corner.
If there is no reflation trade, U.S. markets may be more than 10% too high.
In any case, I leave the investigation for the special counsel that has just been formed, and that will take years to come to real conclusions. But, in terms of the repercussions all this may have in the market, I am a little bit worried. Trump is losing popularity among the population and the Senate. His reflation shock, which was so well embraced by the market, is now looking like a chimera. In just a week, the odds for a rate rise in June have declined from an almost certainty to a 60% chance, while the odds for no further rate hikes in the year have tripled. I’m reducing exposure to the U.S. markets; I’m still bullish on the euro against the dollar; I expect a further rise in volatility; and I’m suspending long bets on Treasury yields (short bets on the bonds themselves). I may change my opinion later, but for now there is an accumulation of negative events that has substantially increased the risks. This market is due a correction, which may take everyone off guard. If there is no reflation trade, U.S. markets may be more than 10% too high.
Comments (0)