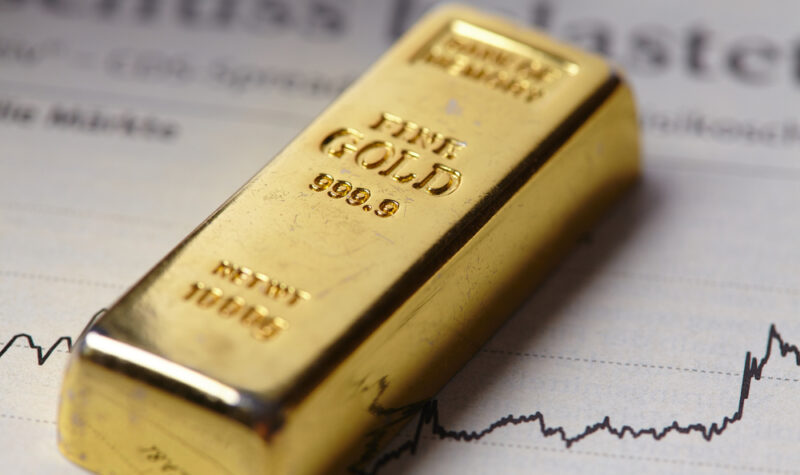
Going for Gold – Some Useful Background Market Notes

Gold is tiptoeing around all-time highs, but may need a catalyst to break beyond current levels. Perhaps it needs a sharp equity sell-off to push it into new high ground.
Despite the mixed picture for gold demand in Q1 2023 The World Gold Council sees a healthy upside for investment.
In its latest report the WGC, the global authority on gold, noted that in the first quarter of 2023 there was a continued momentum in central bank buying, reported as up some 175% year on year – a sure indication of nervousness within the financial sector.
The London Bullion Market Association Gold Price averaged $1,890 an ounce (about 31.1 grams) during the quarter, which was marginally more expensive over the previous year.
The price was over 10% higher than the average for the final quarter of 2022, which was almost matching the record high achieved in the third quarter of 2020.
Demand from central banks experienced significant growth during the quarter.
Official sector institutions remained keen and committed buyers of gold, adding 228t to global reserves.
Resurgent China
There was also a resurgent Chinese consumer demand.
China saw a strong relief rally in the first post-COVID quarter of unfettered consumer spending.
The recovering domestic economy and healthy income growth reignited domestic consumption, while the eye-catching gold price performance spurred investment interest.
Weaker India
That demand from China was contrasted by a weakness in India.
Indian demand fell sharply as local gold prices applied the brakes.
Record high – and volatile – domestic gold prices discouraged both investment and jewellery consumption during the quarter.
Mixed Picture For Gold Demand in Q1
Continued momentum in central bank buying and resurgent Chinese consumer demand contrasted with a negative contribution from exchange traded funds and weakness in India.
There are two primary forms of gold trading in the wholesale market over-the-counter and on exchange.
Q1 gold demand (excluding OTC) was 13% lower year-on-year at 1,081 tonnes.
Inclusive of OTC, total gold demand strengthened 1% y/y to 1,174t as a recovery in OTC investment – consistent with investor positioning in the futures market – offset weakness in some areas.
Bar and coin investment gained 5% y/y to 302t, concealing some large regional variations.
In contrast, net negative demand for ETFs, although modest at -29t, generated a hefty y/y decline compared with the sizeable inflows seen in Q1’22.
Global jewellery consumption was virtually flat at 478t. Jewellery fabrication exceeded consumption as stock building added just over 30t to global inventories.
Gold use in the technology sector continued to suffer from the challenging economic climate.
Demand slumped to 70t – the second lowest quarter in the WGC data series back to 2000.
Uptick In Recycling And Production
Modest growth was reported in both mine production (+2%) and recycling (+5%) which led to a marginal increase in Q1 total gold supply to 1,174t.
The uptick in recycling was largely a function of higher gold prices.
Gold Council Outlook
Investment dominates the outlook for 2023.
The World Gold Council continues to see healthy upside for investment this year, while the picture for fabrication (jewellery and technology) is more muted.
Further robust central bank buying is expected, albeit below 2022’s record.
Modest growth is likely in both mine production and recycling.
Conclusion
The price of gold is already showing that the Q2 report from the WGC will focus on the much-improved LBMA gold price, which is currently looking so much stronger at $2,015 an ounce, after having peaked at $2,047 two weeks ago.
The WGC considers The strong run-up y-t-d has left gold in need of a catalyst to break beyond its all-time high: one likely contender is a sharp equity correction, as valuations remain lofty in the face of deteriorating fundamentals
Gold’s performance during sharp equity corrections has almost always been positive but has varied quite a bit in magnitude; prior gold returns and the level of real interest rates are key factors
At current levels these two factors suggest gold’s response to a sharp equity sell off could sit in the upper end of the historical range.

Comments (0)