Seeking out value in different regions and sectors

The future is undoubtedly rosy, but investors have already squeezed most of the juice from the markets. Filipe R. Costa looks at where the value still remains in markets.
After bottoming out in March last year, equity markets embarked on an impressive run. The Nasdaq 100 doubled its value, while both the S&P 500 and the Dow ran pretty close to that mark. More conservative was the rise of the FTSE 100 (as usual) but still a very decent 50%. During this uptrend, the US dollar sank against FX majors, and is now trading at a 13% discount against the euro and 22% against sterling. Smaller companies and tech are heavy winners around the globe and bond markets have been performing well, particularly the ‘junk’ market. The more conservative investors carrying ‘safe havens’ in their portfolios, like government bonds, are losing money, as bonds yields have been on the rise with the prospect of inflation.
Money continues to flow into risky assets, and tech and crypto have been capturing a large chunk of this flow. I believe that the advent of fintech mixed with excess money printing from central banks and large government stimulus explain much of the trend. If equities have been impressive, what can we say about crypto? Cardano (ADA/USD) is up 6,150% since the peak of the pandemic in March 2020. And it is not alone, as there are many other cryprocurrencies that are thrashing the dollar. Ethereum (ETH/USD), NEO (NEO/USD) and Bitcoin (BTC/USD) are up 2,010%, 838% and 503%, respectively.
There’s still upside left
The current picture seems very attractive. Retail investors are hurrying into tech and crypto to scoop up a share of the profits and contribute to this positive feedback mechanism. The economic fundamentals are good. Central banks aren’t in a hurry to hike interest rates and governments feel debt is no longer an issue. Everything points to further stimulus around the world and this time debts are going to be repaid at creditors’ expense, in the form of inflation. This makes bonds unattractive. I feel sorry for those subscribing a 100-year bond issued by Austria last year at a yield of 0.88%.
With low yields and inflation rising, there’s no other option than jumping into the equities market. However, given the current run, many equities look unattractive like bonds do, as price ratios have risen substantially since last year. For example, the price-to-earnings ratio for the UK, US and European markets was 13.2x, 18.7x and 12.6x in March 2020, respectively. The numbers rose to 22.8x, 30.7x and 21.3x at the end of May 2021. Even if we take this with a grain of salt in the belief growth will come in on the high side, the ratios are a bit high for broad markets. On the lists I have in my computer, the best I can find is a P/E ratio of 13.7x for Sweden and 15.9x for Italy. In terms of sectors, and looking at the US, the picture is also mostly unattractive. Tech carries a P/E of 34.6x, Health Care 32.5x and Industrials 36.4x, just to mention a few.
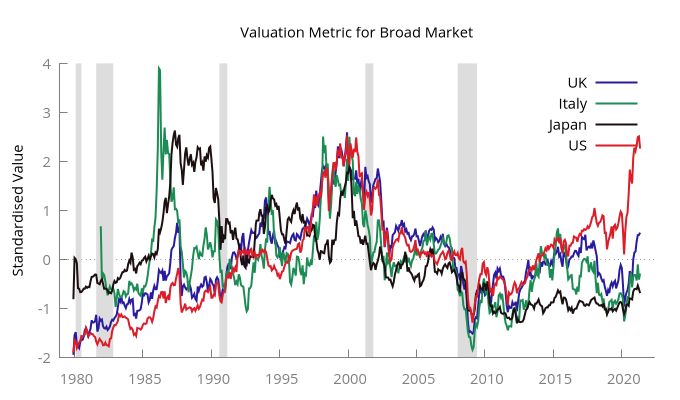
The prospects seem rosy for the global economy but less so for equities because of valuations. With the tremendous run up experienced, it’s difficult to pick up value. Price ratios look ugly. However, I feel that looking at price ratios in absolute terms isn’t the best answer. We need a way to evaluate how high the current ratios are relative to their past and geographically. Historically, some regions and sectors carry higher price ratios than others. This may be a consequence of market conditions and growth prospects. For example, the average P/E between Dec/1979 and May/2021 has been 15.0x for the UK, 18.3x for the US and 34.7x for Japan. The volatility of those numbers also varied widely, with it being lower in the UK and higher in Japan. If history is worth something, then a P/E of 20x may be too much for the UK but not for Japan.
There’s no absolute answer to solve the problem of being able to compare values across space and time. However, I like the standardised version of price ratios. If we rearrange each ratio series by subtracting its average and dividing by the standard deviation, we get a standardised ratio, which is a series with zero-mean and standard deviation of one. These standardised variables take into consideration the historical evolution of the variable and may give a better idea of over- and under-valuation. The standardised values for the UK, US and Japan are 2.09x, 2.20x and -0.94x. This way we can better compare P/E ratios across borders and over time.
Standardising the answer
Using the idea mentioned above, we can look into several markets around the world and try to find those that offer the best value for the money. In the meantime, and because I also have data for the price-to-book ratio (P/B), then why not use it? We can standardise this ratio and build a valuation measure from the two variables. It’s our own valuation metric. I’m setting this new metric equal to the average of the standardised P/E and standardised P/B. We could add more price ratios, like the price-to-sales and price-to-EBIT, and build a more complete measure. There are many possibilities here. But I believe the most important part is to build a metric that captures valuation and that’s comparable across space and time. Let’s take a look at the following table where I show the above value metric for several countries and regions.
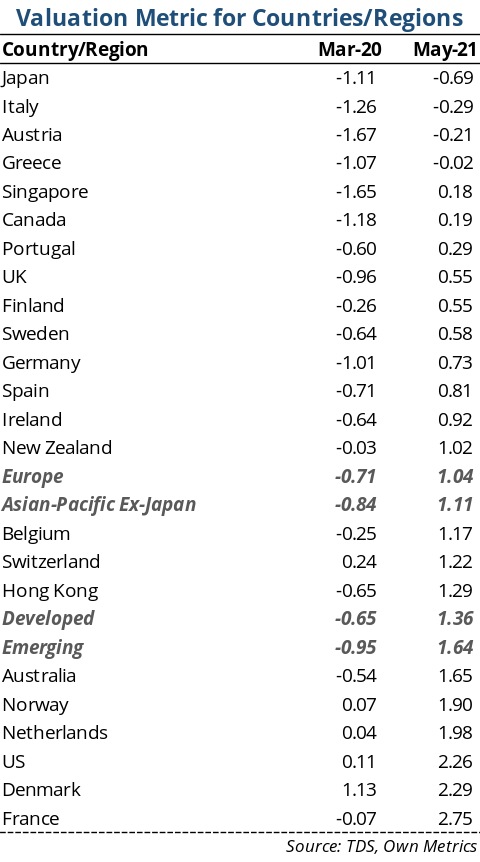
Our new metric has a mean around zero and a standard deviation around one. The market uptrend is clearly expressed in the difference in values between March 2020 and May 2021. All markets were undervalued at the peak of the pandemic, with this undervaluation being more extreme in Austria, Singapore, Italy, Canada and Japan. At that point, at the peak of the pandemic, the US market was eventually correctly priced. Roughly one year later, the story changed. The markets offering more value are Japan, Italy, Austria and Greece. Many European markets still offer very good opportunities, in particular in comparison with the US where the market hit very high price levels.
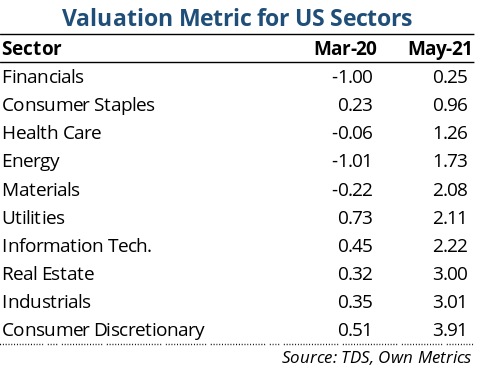
In terms of US sectors, financials and consumer staples offer the best opportunities at this point, while most sectors are unattractive, in particular consumer discretionary, industrials and real estate.
Building a strategy to invest
We have the data, so let’s build the investment strategy and convert words into action. ETFs are always a good option for private investors because they offer wide access to a broad range of assets and diversification for small amounts of money. With this in mind, let’s take a look into the options.
Starting with regional investing, our valuation metric places Japan, Italy, Austria and Greece as the most undervalued countries. We can invest in these countries directly through ETFs, one at a time, because there are MSCI indices targeting all of them and ETFs that proxy for them. The options here are the iShares MSCI Japan ETF (NYSEARCA:EWJ), the iShares MSCI Italy ETF (NYSEARCA:EWI), the iShares MSCI Austria ETF (NYSEARCA:EWO) and the Global X MSCI Greece ETF (NYSEARCA:GREK). The iShares ETFs charge 0.51% per year while the Global X ETF charge 0.58%. All of these target the MSCI country indices and are good proxies for their respective domestic markets. Another option would be to target all countries at the same time. Europe, as a region, offers more value than the US. In this sense, something like the Vanguard FTSE Europe ETF (NYSEARCA:VGK) could be a good option. The problem is that this kind of fund is expected to provide a high exposure to France because the country is one of the largest in Europe. However, according to our metric, this is not desirable at this point. Someone willing to adopt a more complex take following this route could buy VGK and short sell an ETF targeting France. For example, for each $10,000 invested in VGK short sell $1,000 to $1,500 of the France ETF.
Let’s now look into the undervalued financials and consumer staples sectors. It doesn’t come as a surprise that these sectors are undervalued relative to the others. With interest rates being so low for so many years, banks, in particular, have been struggling to make a profit. With the prospects of inflation come prospects for higher interest rates, which benefit banks. Regarding consumer staples, I believe that the sector is too conservative to attract money when markets are rising like they are. Many are attracted by easy money and high growth companies, which aren’t often found in this sector.
Investors looking for a tilt towards the financial sector have several options in the ETF world. For an exposure to the US financial sector, I like the Financial Select Sector SPDR Fund (NYSEARCA:XLF) and the Vanguard Financials ETF (NYSEARCA:VFH). These are the largest ETFs playing in the sector and trade with very decent expense ratios, which is 0.12% for XLF and 0.10% for Vanguard. Both funds give exposure to the big financial players. However, XLF is slightly more concentrated with 55% of its assets spread over its top 10 holdings while this proportion drops to 41% for VFH. At the same time, VFH gives a broader exposure to the sector, holding more than 400 securities.
A third option is the iShares MSCI Europe Financials (NASDAQ:EUFN). This is a good option to get the most out of Europe being more conservatively priced than the US. EUFN gives exposure to HSBC, Allianz, BNP, Banco Santander, among many other financials from Western Europe. Unfortunately, iShares always comes with higher expenses, which in this case, amount to 0.48%.
For an exposure towards consumer staples, the options are similar. I believe that the Consumer Staples Select Sector SPDR Fund (NYSEARCA:XLP) and the Vanguard Consumer Staples ETF (NYSEARCA:VDC) offer all an investor needs. Expense ratios are 0.12% for XLP and 0.10% for VDC and similarly to what happens with financials, the Vanguard offer gets you a broader exposure to the sector. Both funds are heavily concentrated on their top 10 holdings, as most of them are mega caps like P&G, Coca-Cola, PepsiCo and Walmart but VDC is slightly less concentrated.
The future is undoubtedly rosy, but investors have already squeezed most of the juice from the markets. To pick value, we need to put everything in perspective. No one is willing to miss an uptrend but buying the top is certainly mortifying.
Comments (0)