Zak’s Daily Round-Up

FTSE 100 Stocks
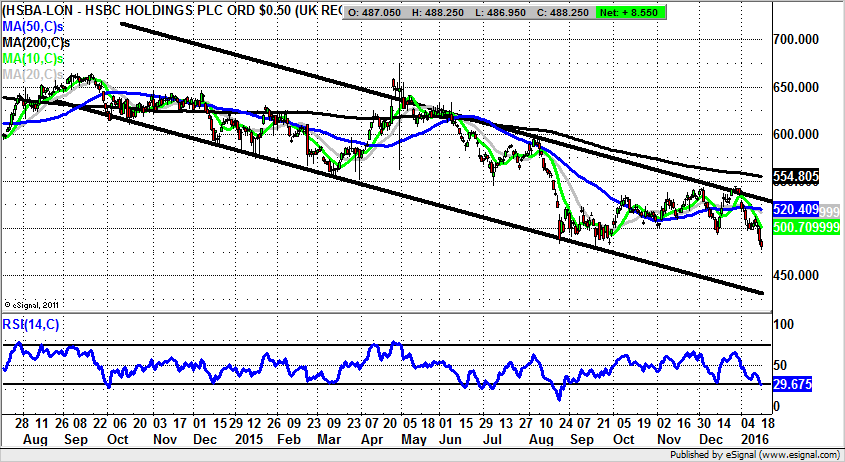
HSBC (HSBA): Exposure to “Submerging Markets”
Having missed out on the worst of the effects of the Global Financial Crisis, HSBC has gone from being the exception that proves the rule as far as the UK banking sector is concerned, to being on the back foot almost as much as the worst contenders such as RBS (RBS), my other FTSE 100 stock of the day. Indeed, it is the combination of scandals, fines and then the meltdown in the emerging markets over the past year – courtesy of the soaring U.S. Dollar – which has really taken its toll. If you throw in the company’s charade regarding whether or not it will stay in the UK, the impression given by the “world’s local bank” is that it really has its fair share of negative issues. This concept is reflected on the daily chart of the stock where we have been on the receiving end of an extended decline since the double top through 750p in the early part of 2013. Since then we have suffered a relatively consistent decline with new resistance tending to come in at and around former support. This is what one would normally expect to see in the more bearish of situations, with HSBC so far living up to the pessimism of this notional charting script. The position now to start 2016 is that we are looking at a decline within a 2014 descending price channel, with the floor of the channel currently running down to 430p. This is the 1-2 month target, in the wake of a relatively prompt end of day close back below the 2015 intraday low of 478p.
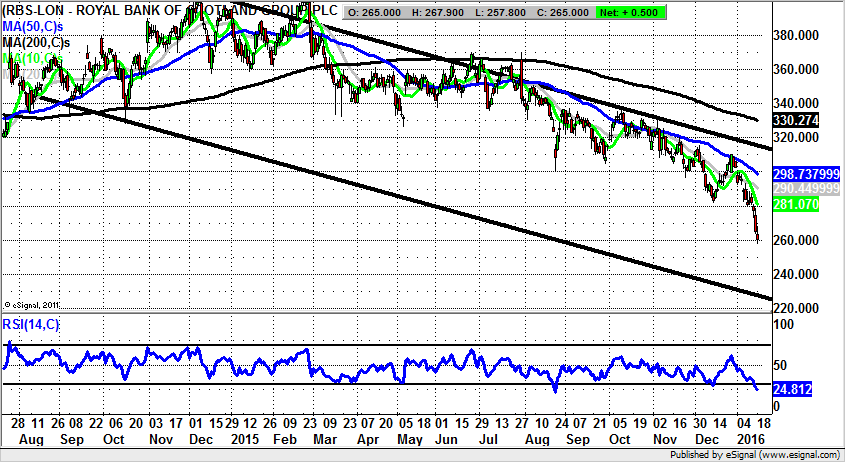
RBS (RBS): “Sell Everything” Including RBS Itself
The RBS “Sell Everything” advice for 2016 hit the Zeitgeist of the worst start to the year in the financial markets ever, and put the State owned bank back on the map. Ironically, the call was so punchy that for a second one nearly forgot the days of Fred Goodwin and RBS’s doomed purchase of ABN Amro in 2008, when it really should have sold everything at the top of the last boom cycle. Indeed, it would have been, and perhaps still could be poetic justice, that the bearishness of the bank turns out to be the floor in the present cycle. So far it seems unlikely. But at the very least, for the sell call to come good we really would have to witness a calamitous fall from three year lows on the FTSE 100. That said, the purpose of the highlighting of RBS here today is actually to look at the shares, and try to get a technical handle on where they may go next. What can be seen here on the daily chart is the way that there has been an accelerating decline within a descending price channel in place since as long ago as August 2014. In the near term the negative trigger for the price action was the loss of the 200 day moving average then at 360p plus. It is now falling at 329p and is likely to pressure the shares for quite some time. As for the potential extent of the downside, we are looking at 2014 support line projection now pointing at 230p. This is expected to be hit on a 2-3 months timeframe, especially while the December support at 281p caps the price action on a weekly close basis.
Bull Call
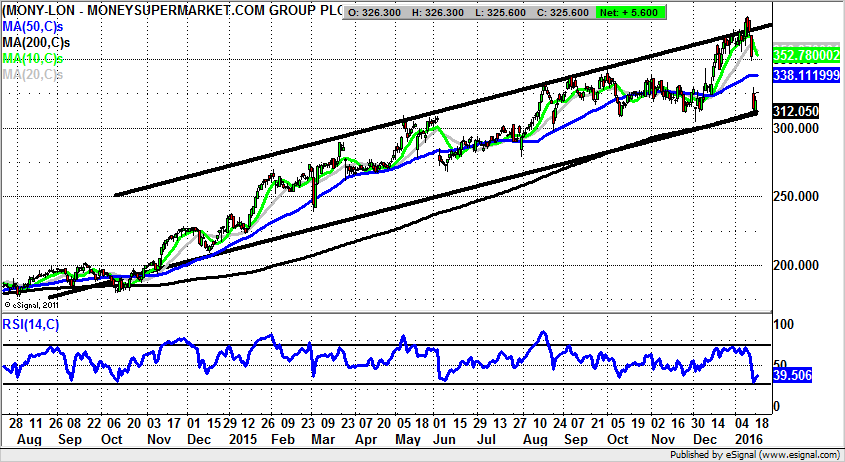
Moneysupermarket (MONY): Not Just a Twerking Ad Campaign
Ordinarily one might be somewhat cautious regarding a company whose main essence / business model appears to be making high profile adverts. In the case of Moneysupermarket one can acknowledge that the price comparison group has twerked its way into the national consciousness – at least in its latest manifestation. But it can be said that although some may dismiss its way of promoting itself as being something of an annoying novelty, there is certainly logic behind the promotion of the company. This is centred on a land grab for the brand, in much the same way that Rightmove and Zoopla have a stranglehold in the online estate agent area. The lesson since the dot.com era 17 years ago is that in this space first mover advantage is everything. Once you are saved in the Bookmark you are generally there for life. Therefore Moneysupermarket is as much or even more about name recognition and the branding, as it is the business model. Looking at the technical position it can be seen how there has been a relatively persistent uptrend in place over the past year and a half, with a rising trend channel drawn here originatiing from as long ago as Septemeber 2014. The floor of the channel currently runs level with the 200 day moving average at 312p, thus providing notional double support. Therefore, the view here is that provided there is no weekly close back below the 200 day line we should at least see shares of Moneysupermarket head towards the top of the January gap down at 348p over the next 2-4 weeks.
Bear Call
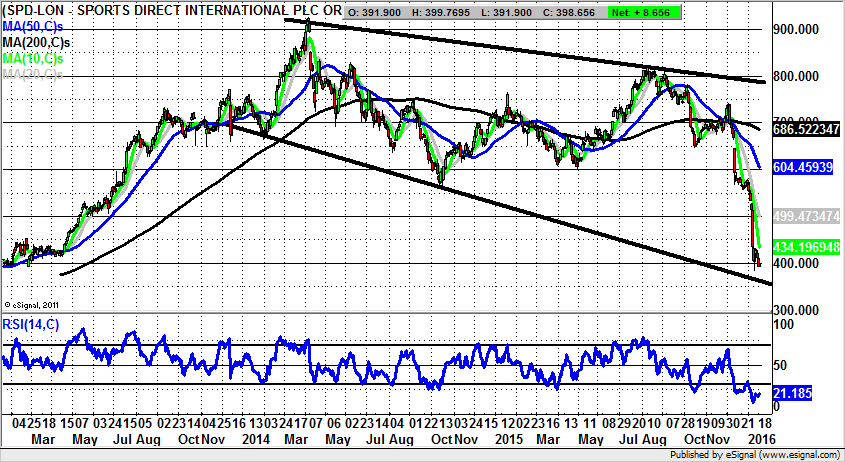
Sports Direct (SPD): The Unacceptable Face of Retailing?
It can be said of Sports Direct that it was a stock market phenomenon on the way up, and certainly looks like being one on the way down. This is said even though the price action performance that we have seen to the downside over recent weeks has been spectacular – and painfully so, if you are a bull of this situation. Clearly, the fundamental plus point in terms of what this company does – sell big brands in big volumes – is not one which is going to change anytime soon. However, it may be that as with retailers of all shapes and sizes, we are facing the issue of margins in a deflationary environment. This may of course explain the reason for the less savoury stories regarding working practices at Sports Direct, over and above the aftermath of the rise in the minimum wage. Looking at the present configuration of the daily chart it can be seen how there has been a precipitous drop, coming in the wake of the unfilled gap to the downside in December. This was all the more bearish given the way that it melted the October 650p support zone, and was of course followed by a fresh gap down earlier this month. The position now is clearly that the shares have in the near term overextended to the downside – a point witnessed by the very oversold RSI at 20 currently. The best way forward at this stage for technical traders is probably to wait on a rebound back towards the 10 day moving average as high as 434p. At least while there is no end of day close back above this level the eventual one month downside target could be as low as the floor of a late 2014 broadening triangle at 350p.
Comments (0)