Zak’s Daily Round-Up: ITRK, VOD, WTB, OCT and SRB

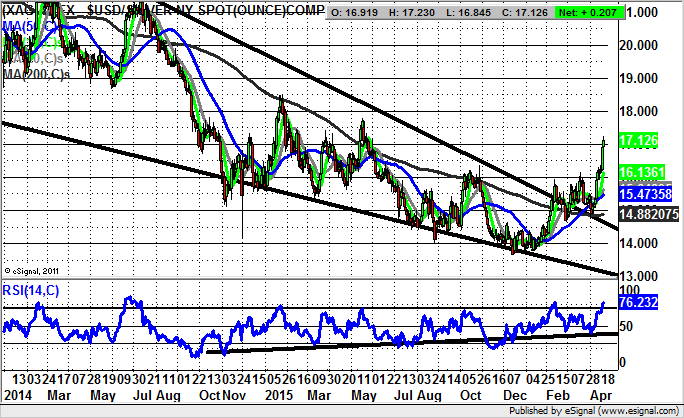
Market Direction: Silver above $16.50 Targets $18.50 Plus
Intertek (ITRK): Momentum Trade
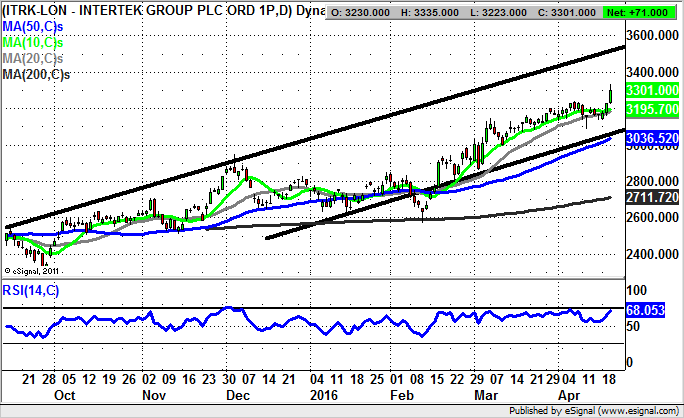
Even though most of us are probably not familiar with the exact nature of the business model of Intertek, it is the case that the company has been a potential takeover target almost from the day it came to the London stock market. However, for those who are tired of playing the waiting game it would appear that from the recent price action, something is afoot here, even if it is just a significant positive rerating.
The name of the game at the moment is to follow the trend within a rising price channel, which has been in place since as long ago as September. The floor of the channel currently runs level with the 50 day moving average at 3,036p, although in the past few sessions it has been the 10 day moving average of 3,195p which has dominated the technicals. On this basis one would venture to suggest that while there is no end of day close back below the 10 day line, we should at least see a journey towards the 2015 resistance line projection, currently heading as high as 3,550p. What is interesting to note currently is the way that even though we are at near-term highs for the shares, the RSI at 68 is still just a tad under the overbought 70 level. This would suggest that there is still some gas in the tank as far as further potential bullish action is concerned.
Vodafone (VOD): 260p plus Technical Target
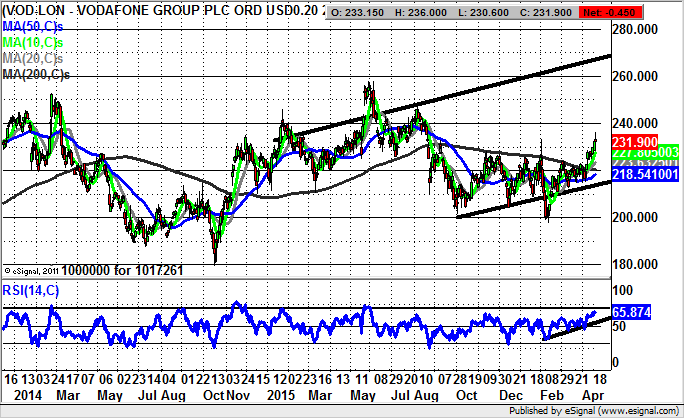
It can be said for Vodafone that while the lack of any M&A developments is disappointing, at least this has been a relatively steady stock versus many leading FTSE 100 contenders earlier this year. This point is underlined on the daily chart by the latest April break above the 200 day moving average at 220p, an event made all the more significant by the way that this feature is still falling. It is typically the case that a break for a stock or market above the 200 day line as it is heading lower is a much more bullish event than when sideways or up given the extra force of momentum required to clear it.
The current position is that we would feel that while there is no end of day close back below the 200 day line there could be considerable upside for shares of Vodafone. The favoured destination at this point is the top of a rising trend channel from the beginning of last year as high as 265p. The timeframe on such a move is seen as being the next 2 to 3 months.
Whitbread (WTB): January 4,500p Resistance Line
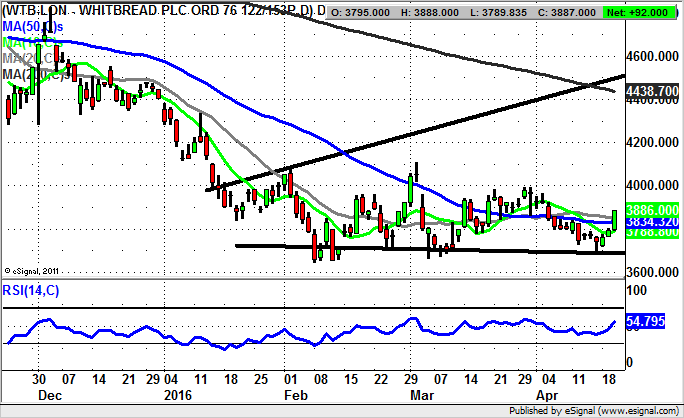
On the daily chart of Whitbread since the start of the year it can be seen how the price action has been relatively disappointing in terms of the decline with the market going down into the early part of February, but then a lack of a credible rebound ever since. Nevertheless, the shares appear to be a range between 3,650p and 4,000p, and therefore at least it can be said that there are decent signs of stabilisation. Perhaps what is missing more than anything else over the near term is a clearance of the late-March resistance at 4,000p, as only above this level would one feel confident that a lasting base was in place after the higher April support versus March and February. Nevertheless, as little as an end of day close above 4,000p should be enough to take the shares up to the target implied by resistance from January currently heading as high as 4,500p. This would take the shares just above the present level of the 200 day moving average at 4,438p.
Small Caps Focus
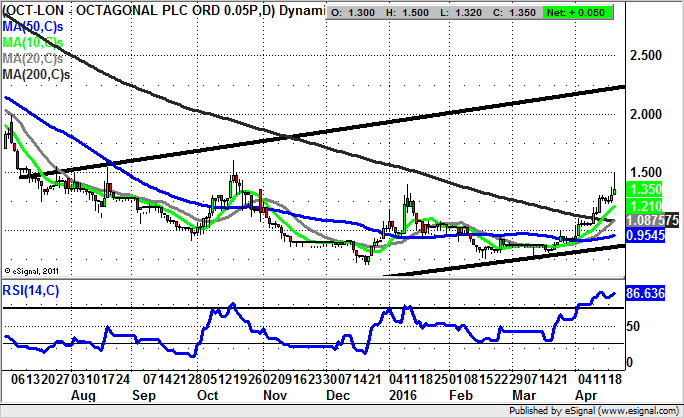
Octagonal (OCT): Bullish 200 Day Line Break
Shares of Octagonal appeared to be a somewhat unlikely recovery candidate at the end of last year, and although the initial January spike towards the 200 day moving average did fizzle out, since then higher lows and a break through the 200 day line, now 1.08p, have given this situation a decent bullish setup. Indeed the view at the moment is that we could see a sustained rally over the next couple of months, with the only slight negative at the moment being the way that with the RSI well over 80/100, this situation is very overbought near term.
The best way forward is therefore to look to any dips towards the 10 day moving average, currently at 1.21p to buy into, with only a weekly close back below the 200 day line delaying the upside scenario to any significant extent. Indeed, while the 200 day line holds we would be hopeful of a top of 2015 price channel target as high as 2.25p over the next 1 to 2 months.
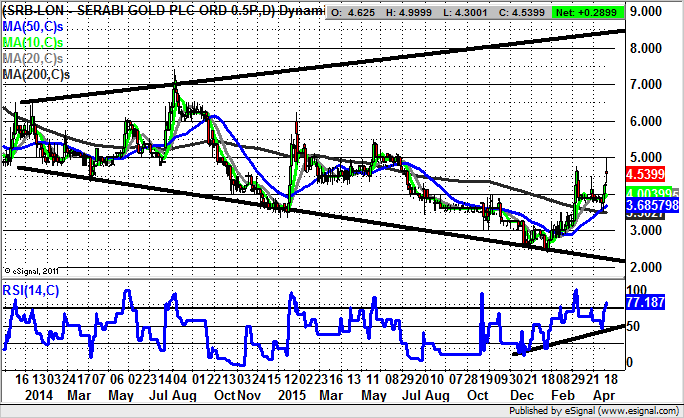
Serabi Gold (SRB): Broadening Triangle towards 8p Plus
What can be seen on the daily chart of Serabi Gold is the way that the overall pattern here has been that of a broadening triangle which has been in place for as long ago as the beginning of 2014. The big development over the past couple of months has been the consolidation the stock has made over the 200 day moving average at 3.30p. Indeed, the latest twist has been the clearance of late March resistance at 4.5p. The more closes the stock can manage above this level, the greater the chance of a fresh sustained move to the upside. The initial target is clearly the former January 2015 price action at 6p plus over the next 4-6 weeks. However, the 2-3 months target is as high as 8.5p at the 2014 broadening triangle top. Clearly at this stage only sustained price action back below the 200 day moving average would really be a significant delay to the upside scenario. But at least any initial retracement would cool off the overbought RSI at 70 plus, and improve the risk / reward of going long.
Comments (0)