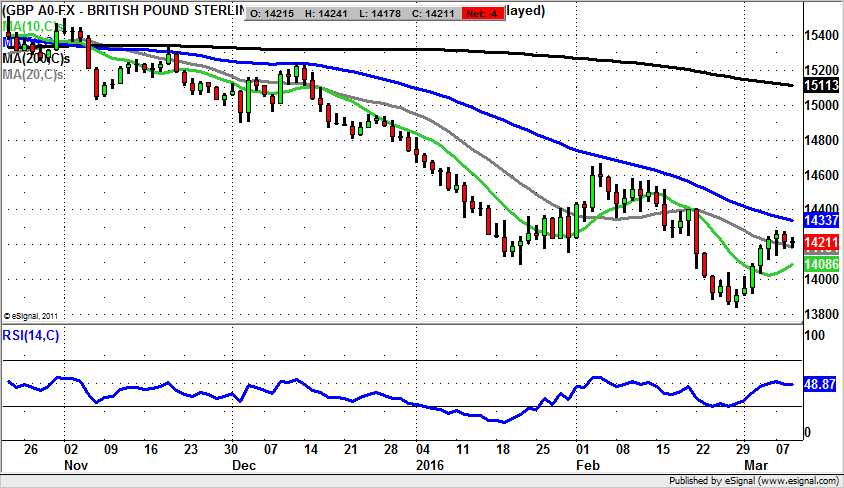
Market Position: Sterling / Dollar below $1.4350 Risks $1.40 Again


Cairn Energy (CNE): 235p 2015 Price Channel Target
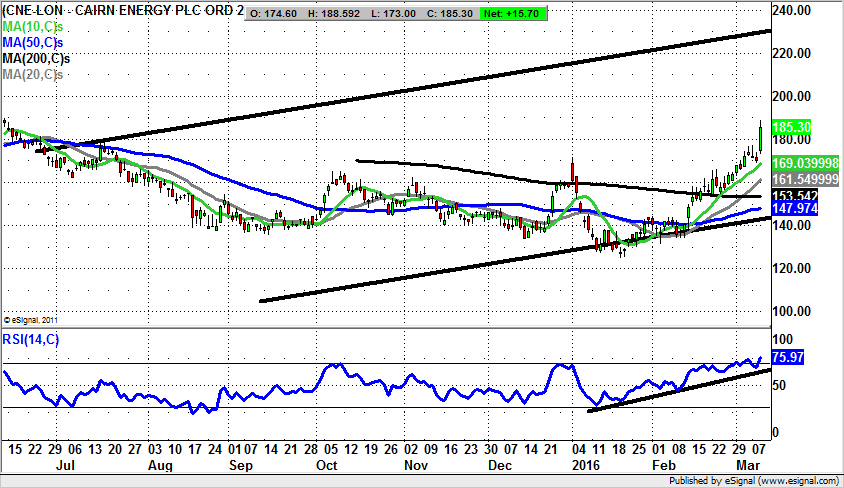
It has been the case for quite some time that Cairn Energy shares have been on my radar as a possible extended bullish situation. Unfortunately, for much of the past year and a half conditions for this stock have not exactly been helpful on a macro sense or indeed relating to the newsflow of the company itself. But it can be seen that in recent weeks, with something of a selling climax in place as far as the oil price is concerned, and with Brent back above $40, there has been an excuse or two to reinvestigate this company as a possible bottom fishing opportunity. As for the trigger for a possible bounce, we have been treated to a reasonably good one coming in the form of results from the flow rates at the latest appraisal well offshore Senegal. This breakthrough in the Sangomar block looks to have really cheered the market, perhaps much more than one would have expected, with the shares flying nearly 10% higher at 185p. The question now from a technical perspective is whether the stock has done enough to be back in place as a situation we can get into for the long haul? Of course, much has already been achieved over the past month since the higher low above 130p versus what was clearly a selling climax in January. All of this has occurred within a rising trend channel which has been in place since as long ago as July last year. The floor of the channel currently runs at the 50 day moving average level at 147p, and is effectively backed by an RSI uptrend line in place since the beginning of the year running through the 60/100 level. What one would suspect now is that there shall at least be progress towards the May / June 191p peak, with a weekly close back above this old resistance suggesting that the stock can make good on the implied target at the top of a rising trend channel from June last year at 235p. The timeframe on this best case scenario is as soon as the next 2-3 months. At this stage the best stop loss is regarded as being an end of day close back below the 10 day moving average currently running at 168p – a reasonable risk / reward ratio on a possible 235p target.


Prudential (PRU): Gap Reversal Back Towards 1,500p
It would appear that judging by the latest update from insurer Prudential, we have little to be concerned about either with regard to either the state of Far East economies, or leading companies in the FTSE 100 paying out dividends. This is because the group has just served up a 19% rise in annual profits, as well as delivering its first special dividend since 1970 – a time when even I was young. The driver of growth is the Asia life sales area, something which perhaps gives us hope that we are seeing a bump in the road for the Far East, rather than the meltdown that some fear. Looking at the daily chart perspective it can be seen how there has been a sharp rebound from the February floor under 1,100p in the form not only of a V shaped bounce, but also a bear trap gap reversal. This would suggest we should assume there is strong momentum behind the latest recovery, over and above the positive fundamental update we have been treated to. The chances at this stage are that while there is no end of day close back below the 50 day moving average at 1,307p we shall see a follow on revival back up to the main 2015 resistance line from last summer at 1,510p. The timeframe on such a move is regarded as being the next 4-6 weeks.
Small Caps Focus
Armadale Capital (ACP): September Support Line
There is clearly disappointment in the air for shares of Armadale Capital given the latest lunge to the downside. This is all the more disappointing given the way that ahead of yesterday’s fall the technicals were actually looking quite encouraging, as if a lasting base was already in place. In fact, it may be correct to suggest that the shares are down, but not quite out. This is said on the basis that the shares have found a line of support in place from as long ago as September at 2.65p. This implies that provided there is no end of day close back below this number we could yet see a recovery back towards the main 2015 triangle resistance at 3.7p over the next 2-4 weeks. But only a weekly close above the September line really gets Armadale Capital into the full bull mode aspect again.
LGO Energy (LGO): Support above 50 Day Line Points Back To 0.5p
I have to admit to looking at LGO Energy from a technical perspective with a slight sense of trepidation, given the way that the pitch here is certainly distorted by the ongoing funding position question marks. But at least from a charting view we can say that there has been decent groundwork achieved over the recent past. This is particularly the case in terms of the recovery of the 50 day moving average last month at 0.29p. The message at the moment is therefore that provided there is no end of day close back below the 50 day line, a retest of the recent spike towards 0.5p is possible over the next couple of weeks. Indeed, it may be said that if there is a weekly close back above 0.5p by the end of March one might be optimistic enough to call the shares as high as the top of a rising trend channel from November, currently pointing to 0.75p, But it should be noted that this is certainly the most bullish scenario, and that stop losses just below the 50 day line should be enforced very strictly.

