Zak’s Daily Round-Up: BKG, RR., AMER, PANR and XEL

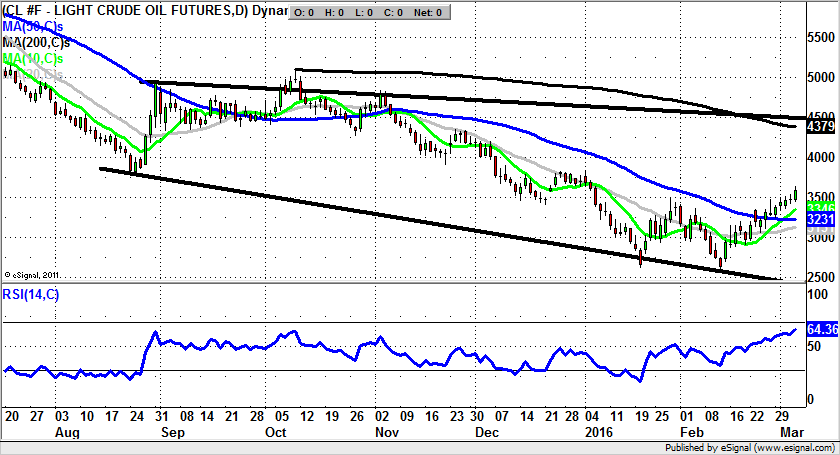
Market Position: Break of $35 Opens Up $43 on WTI Crude
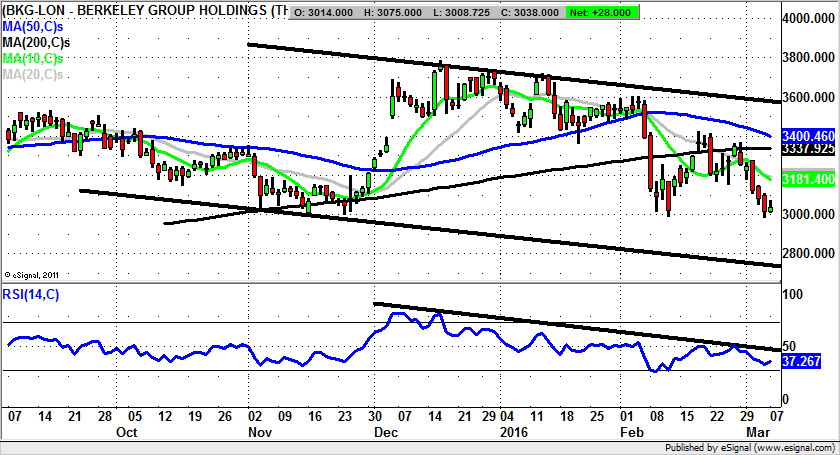
Berkeley Group (BKG): Questioning the Bull Argument?
While of course on a fundamental perspective it can be said that the housing market and housebuilders are supposed to be a one way bet, housebuilders shares are not looking so sprightly. The latest developments here on the daily chart of Berkeley Group underline this divergence between technicals and fundamentals, in the sense that rather than the clear uptrend one might have expected, instead we are seeing recent months looking distinctly flat. Indeed, there has been a decline within a falling trend channel in place from as long ago as October. The floor of the channel currently has its support line running as low as 2,780p, a level which may be regarded as the 1-2 month downside target. This is particularly the case while there is no end of day close back above the 10 day moving average at 3,181p. Another point to note though, which may complicate matters, is the fact that there is one month support just below the 3,000p level. This would suggest it may be worthwhile for cautious traders to wait on an end of day close back below this psychological big figure before taking the plunge on the downside. There is the hint of bullish divergence in the RSI window, which also implies that it may be best to wait on a fresh show of weakness before taking the plunge on the downside, even though the extended top on the daily chart since Christmas appears to be a lasting reversal feature.
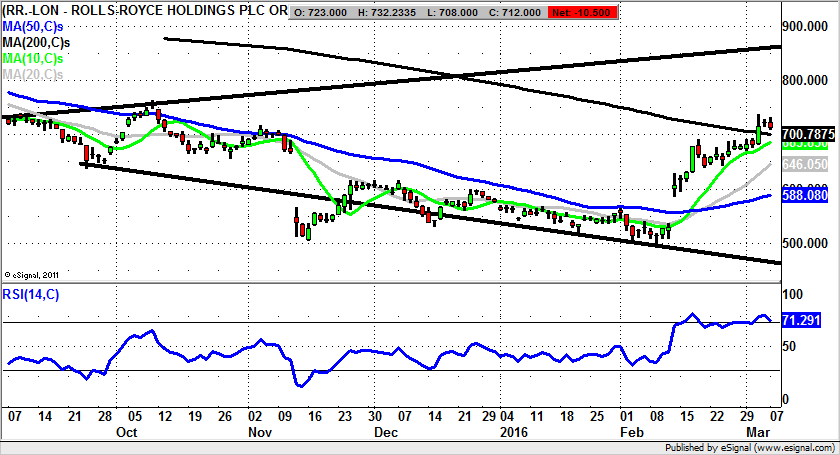
Rolls-Royce (RR.): Island Reversal Could Reach 850p
Although in the recent past it may be said that Rolls-Royce has been more famous for its regular production of profits warnings rather than jet engines, apparently the original business model is still running and may start to make an impact again once the company manages to sort itself out. What can be seen on the daily chart is the way that the uncertainties over exactly what is going on here, as well as the stresses and strains over the fundamental position, have all led to quite a dramatic share price chart in recent months. The most dramatic part is arguably the February unfilled gap to the upside through the 50 day moving average at 588p. This has created an extended island reversal from November, which is difficult to argue with in terms of being a very powerful reversal signal. Indeed, the view now is that the recovery momentum of the recent past is likely to be maintained, at least in the first instance. What will be key is the area of the 200 day moving average, now at 700p. Above this feature on an end of day close basis and the top of the overall broadening triangle from as long ago as September at an implied target of 850p could be on its way. Indeed, at this stage only back below the former February resistance at 691p – the initial peak – would even suggest that there shall be a delay in the ongoing upside scenario. This is anticipated even though we have of course already been treated to a significant rebound over the past month.
Small Caps Focus
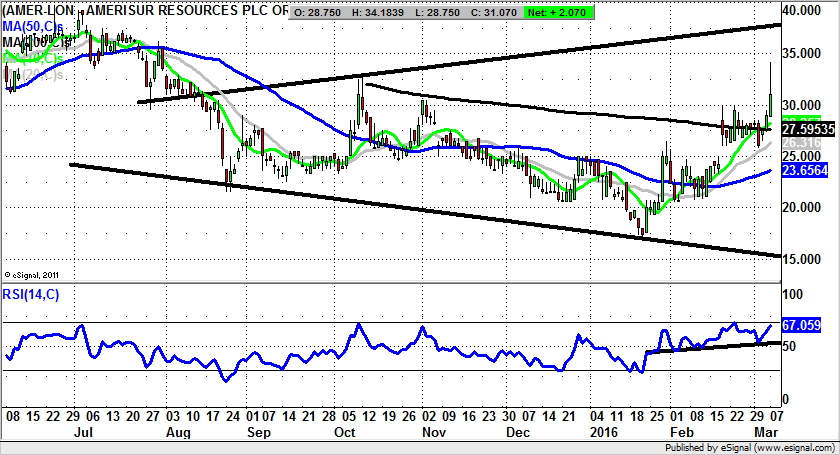
Amerisur (AMER): Broadening Triangle Target at 38p
I have to admit that after a near 30 year odyssey on charting methods and techniques, the set up that I came to latest is the one that I now use on a very frequent basis. It is the broadening triangle, and tends to get wheeled out when no other patterns really seem to fit the price action. This can be seen on the daily chart of Amerisur at the moment, where we have a setup which has been in place since as long ago as August last year. In fact the only real negative with the broadening triangle is that when you first draw one the implied target can actually seem to be a little too optimistic. This was certainly the case with Amerisur when this was spotted as a buy opportunity a few weeks ago for a potential journey to 30p plus. The position now in the wake of the gap to the 200 day moving average at 27.59p is that provided there is no end of day close back below this feature, we would be expected a 38p target to be hit as soon as the next 2-4 weeks. At this stage only back below the gap floor at 25p would even begin to delay the upside scenario.
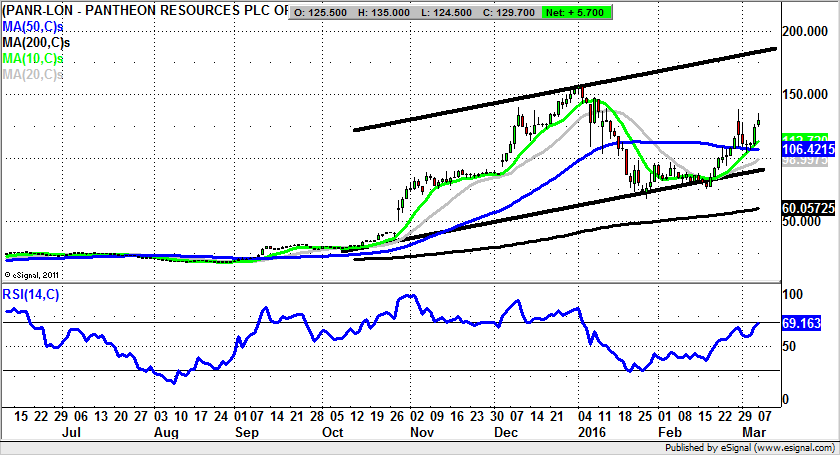
Pantheon Resources (PANR): 185p Price Channel Target
Pantheon Resources has been a phenomenal stock market highlight even when the price of Crude Oil was falling like a stone, and therefore one might logically assume that as this commodity starts to find its feet and perhaps even rally through $40 a barrel, we might even see traders get fully behind this stock again. The reason for saying this now is the way that we are trading in the aftermath of a higher low for February versus March, a rebound off the floor of a rising trend channel at 80p, and currently the V shaped bull flag resting on the 50 day moving average at 106p. The message at the moment is that provided there is now no end of day close back below the 50 day line, the overall target here is as great as the October price channel top of 185p over the next 2-3 months.
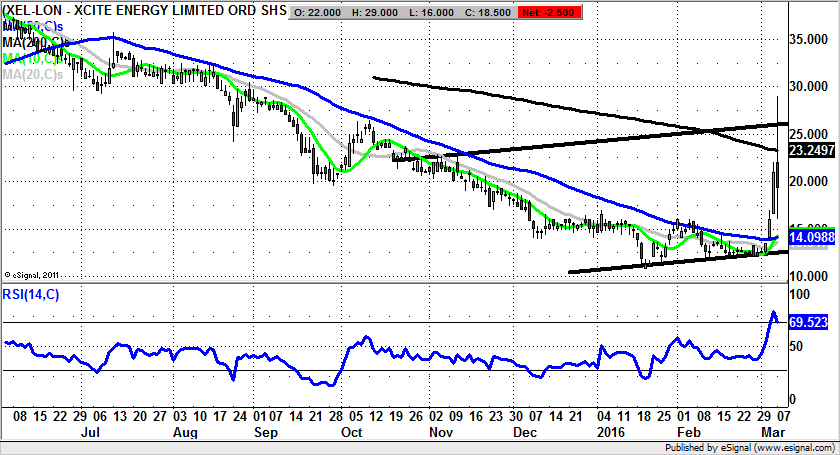
Xcite Energy (XEL): 25p Technical Target Hit
We have a quick mention of Xcite Energy, which perhaps against the fundamental odds appears to be back in business in terms of hitting the previously discussed somewhat unlikely sounding technical target of 25p. The position now is that from a technician’s perspective we are waiting on a weekly close above the 200 day moving average at 23p to prove that this stock is indeed back in sustained bull mode. Otherwise, after all the recent fireworks it may be best for the bulls to stand aside.
Comments (0)