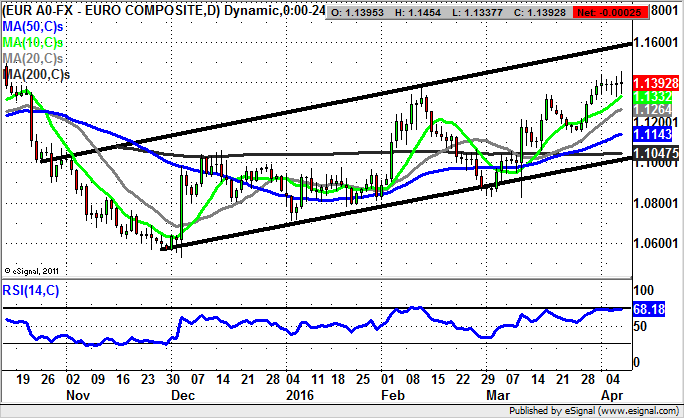
Market Direction: Euro/Dollar above $1.1250 Targets $1.16


ARM Holdings (ARM): 1,170p January Price Channel Target
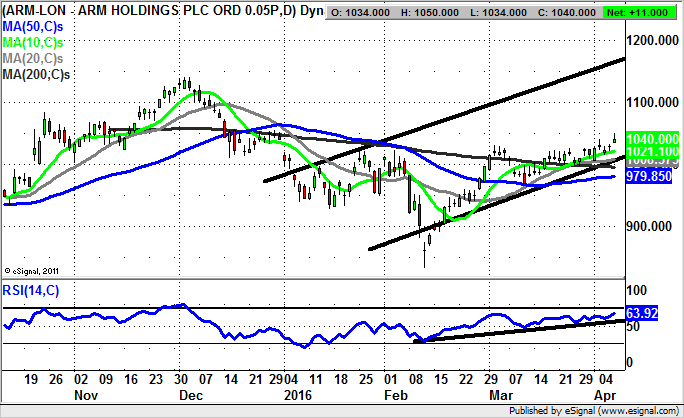
Although ARM Holdings has been a favourite play of mine over 15 years since the Dotcom Bubble burst, all through this period the cynics seem to have been pointing out how the high p/e rating is difficult to justify. This may of course be the case, but the FTSE 100 constituent is at least a leading light among UK tech stocks. As far as the charting picture is concerned, here on the daily timeframe it can be seen how there has been a rising trend channel in place since the start of the year. The big turnaround here came with the two day island reversal served up in February. This was a cracking charting buy signal, especially as it was combined with strong bullish RSI divergence in the oscillator window off the back of the much lower price action seen that month versus January. The view now is that we expect to see further progress to the upside, given the recent recovery of the 200 day moving average, now at 995p. The overall message here at the moment is that provided there is no end of day close back below the 200 day line, one would be justified in looking for a rally up to the top of the 2016 price channel with its resistance line projection currently heading as high as 1,170p. As far as the trading strategy is concerned, one would probably be looking for any dips towards the 10 day moving average now at 1,021p to buy into, if only to improve the risk/reward of going long.


Sainsbury (SBRY): Continuation Gap Implies 320p
It would appear that even though Home Retail Group, the former owner of Argos, did not exactly flourish as an independent company, the market is looking to a future when this purchase by Sainsbury does help the bottom line. Indeed, it is evident on the daily chart that the shares of the grocer have been firm of late and that investors have been buying ahead of the Home Retail Group takeover going through over the past few days. This is said on the basis of the two gaps to the upside in February, the second through the 200 day moving average – usually a very robust charting development. We can also factor in the way that the end of last month served up a golden cross buy signal between the 50 day and 200 day moving averages. This is usually a solid signal if it comes through in a relatively slow moving market where the crossover has been relatively near to the low of the move in question. In the case of Sainsbury it can be seen how despite the way the cross came in towards the 280p range highs, there is still notionally enough room within the rising trend channel from August to offer a reasonable trade. In fact, the expectation is that the 320p 2015 price channel target could be hit as soon as the next 1-2 months, especially while there is no end of day close back below the former 263p February resistance.
Shire Pharma (SHP): 200 Day Moving Average Target
It was something of a shock to me that the alleged centre of the world for capitalism – the United States of America – has blocked a deal between Pfizer and Allergan, on the basis that it would mean the former could obtain a lower overall tax rate. Obviously, forget about profitability, synergies, inventing new life saving drugs, or the right for companies to decide their own fate and not be bullied by Big Government – who are after all, so good at doing business… What is even more interesting about this affair is the way that traders/investors seem to think that after being bullied by the U.S. Authorities over Allergan, Pfizer would decide to run the gauntlet again and go for a UK company such as Shire. The problem here is that if the inversion tax rate was even a dollar cheaper (quite likely), such a deal would be out of the window as well. But at least for now it can be said that while there is no end of day close back below the initial April resistance at 4,209p the upside for the drugs giant could be towards the present position of the 200 day moving average at 4,549p over the next 4-6 weeks.
Small Caps Focus
Imaginatik (IMTK): Key 200 Day Line Resistance
Stakebuilding news has come in for Imaginatik in the wake of the latest share price recovery, with the point of interest being whether this is a flash in the pan situation, or one which really could have legs. Clearly, in the near term giving the benefit of the doubt to the upside scenario has not been a very fruitful thing to do.
What can be said for the daily chart configuration is that we are looking at a situation where the key resistance of February at 3.64p has been cleared. The ideal scenario now is that there is no end of day close back below the old February peak, ahead of a “minimum” test of the 200 day moving average at 4.99p. The real lift off though, would be a weekly close above the 200 day line to open up the possibility of a top of July broadening triangle target of 8p plus. The timeframe on such a move could be as soon as 4-6 weeks after any sustained clearance of the 200 day line. At this stage only back below the former March peak of 3p would really be regarded as negative enough to delay the upside scenario. In the meantime any dips towards the February high of 3.64p can be regarded as buying opportunities – although with the proviso of keeping an eye on this “stakebuilding” situation.

