Zak’s Daily Round-Up: BARC, CPI, EZJ, STAN, 88E and ASC

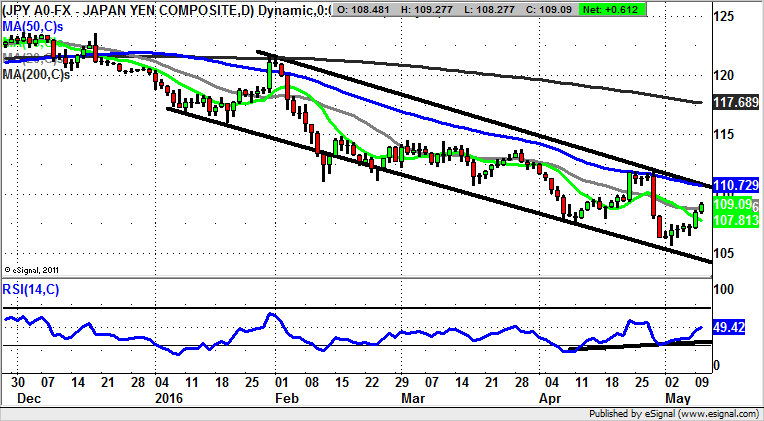
Market Direction: Dollar/Yen Rebound towards 111
Barclays (BARC): Possible Support Zone
The current technical position on the daily chart of Barclays is interesting in the sense that we are on something of a knife edge regarding the technicals. This is said on the basis that while there is a higher low for the start of May versus April, the overall trend here is determined by the still deeply falling 200 day moving average at 212p – and therefore very much bearish. Nevertheless, the latest price action is backed by an uptrend line in the RSI window which has been in place since as long as January, and of which the oscillator trace has just bounced off.
All of this would go to suggest that we have a possible buying opportunity for aggressive traders in the sense that as little as an end of day close back above the 50 day moving average of 162p, just below current levels, could lead the stock back up to 180p, which was the area of last month’s resistance. The timeframe on such a move is regarded as being the next 2 to 3 weeks, or even sooner if we see a decent close above the 50 day line later today.

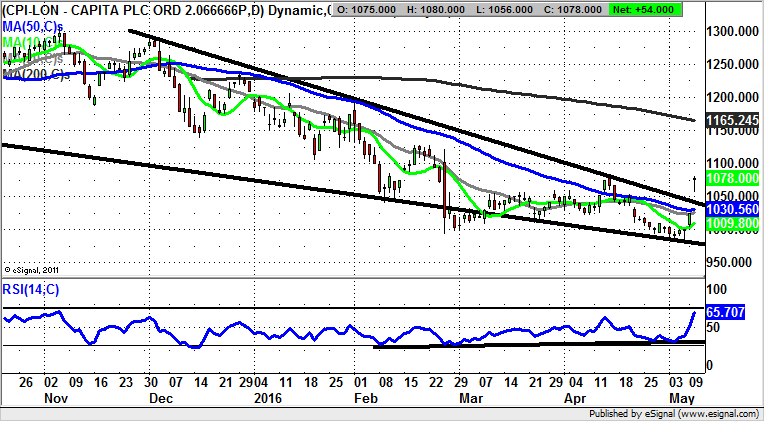
Capita (CPI): Bullish Falling Wedge
As for the current position on the daily chart of Capita, the shares are trading in the wake of yesterday’s write-up here where the thought was we were looking at a possible wedge shaped reversal to the upside. Given the way that the shares have jumped over 5% so far today breaking the resistance line of the wedge, it would appear that other technical traders had the same idea, and have chased the stock higher.
In terms of what the best approach here may be, it can be said that at least while there is no end of day close back below the 50 day moving average at 1030p, we would expect further significant upside. This could be as great as the area of the 200 day moving average at 1,165p, a destination which could be hit as soon as the next month given the way the company has just reassured on its trading outlook.
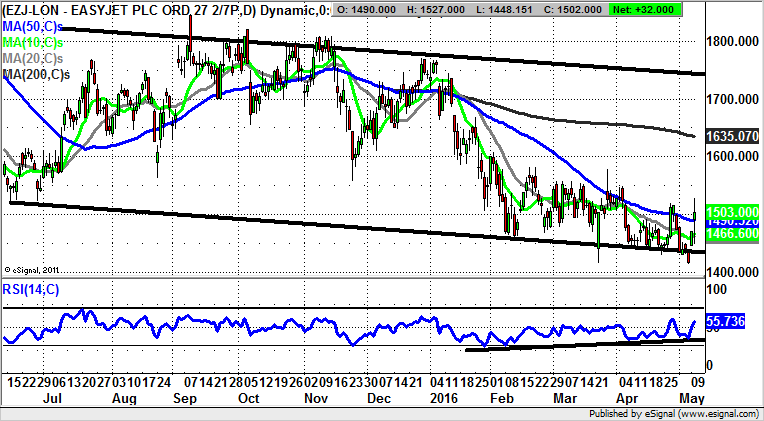
EasyJet (EZJ): Bear Trap Gap Reversal
We have a rather enigmatic daily chart set up as far as EasyJet is concerned, the aftermath of the latest update from the no frills airline notwithstanding. This is said on the basis of an extended consolidation for the stock since February. The low of that month was 1,415p, and was narrowly broken for May with a 1,413p floor. All of this adds to the feeling of a stock bumping along the bottom, with the expectation now being that of at least an intermediate rebound back towards the 200 day moving average at 1,635p. The timeframe on such a move is regarded as being as soon as the next 4-6 weeks, especially while there is no end of day close back below the recent gap floor at 1,435p – where the bear trap gap reversal originated.
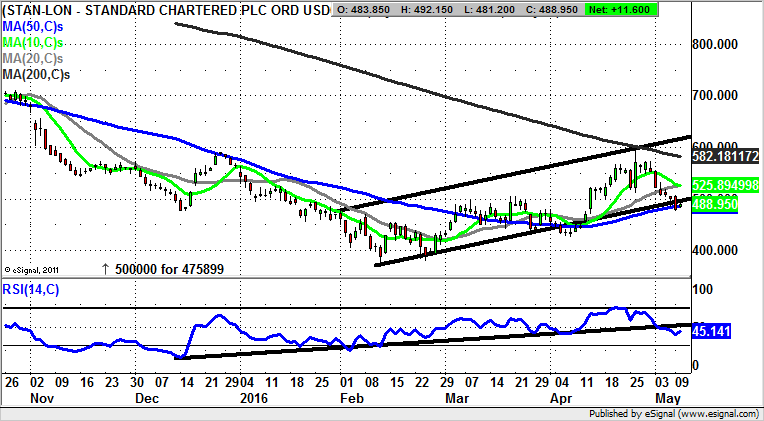
Standard Chartered (STAN): Bear Trap From Below 50 Day Line
Intriguing, is the best description for the latest charting setup at Standard Chartered, especially given the way that the pattern here over the past couple of months, with the failure near the 200 day moving average now at 582p closely resembles that of the Dax – the blue chip German index.
The position now on the daily chart is that the shares are trading in the aftermath of a bear trap rebound from below the 50 day moving average now at 486p. This should mean that provided there is no end of day close back below the 50 day line / the floor of a rising trend channel from the beginning of February, we could be treated to at least some intermediate upside. The favoured destination at this point is seen as being back towards the 10 day moving average at 526p over the next couple of weeks.
Small Caps
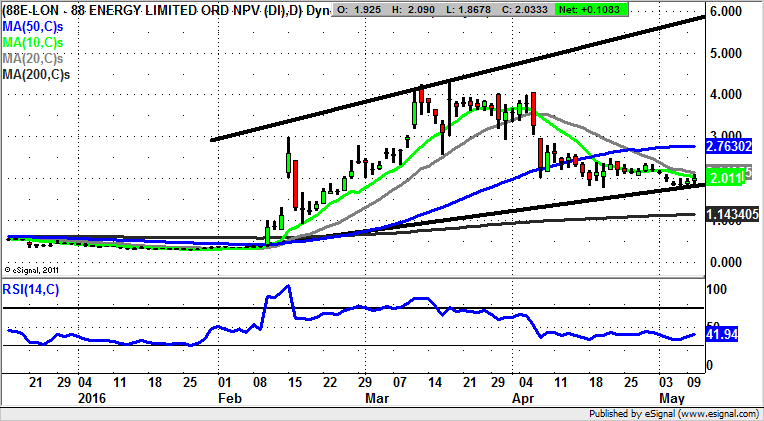
88 Energy (88E): Gap Top Target
88 Energy has without doubt been one of the small cap stocks of the year to date, and it would appear that whether we head higher or lower from now, this will still be the case for many private investors. What is noticeable currently on the daily chart of this situation is the way we have seen the aftermath of the March – April island top reversal, with the stock also losing the 50 day moving average at 2.76p.
All of this goes to suggest that while there is no end of day close back above the 20 day moving average at 2.13p, shares of 88 Energy may continue to drift. But given how far the stock has already fallen it would be surprising if we saw much in the way of downside from where we are now. The initial target above the 20 day line is regarded as being back towards the top of the April gap at 3.04p on a 2-4 weeks timeframe from any clearance of the 20 day line.
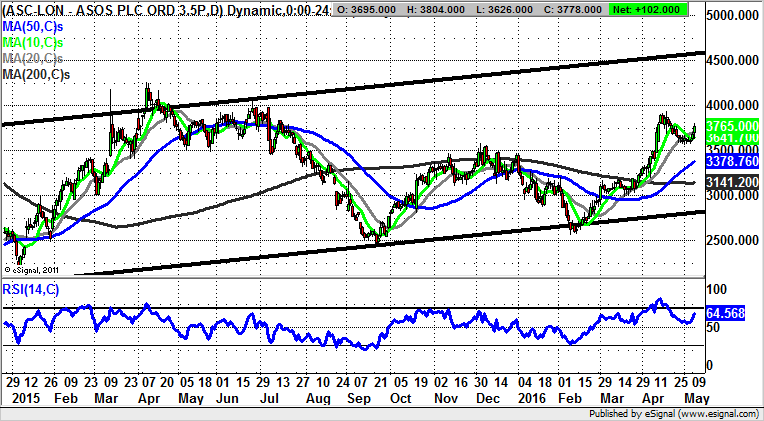
ASOS (ASC): 4.500p Technical Target
ASOS has been a charting favourite of mine for quite some time, although it has to be admitted that until quite recently this faith has not really been rewarded. But at least it can be seen on the daily chart how the price action of April and May to date will have gladdened the hearts of the bulls. This is because on the retracement from last month’s highs towards 4,000p we have seen new support come in well above the former December 3,575p peak. The assumption to make now is that provided there is no end of day close back below the end of year peak we could see shares of ASOS head as high as the October price channel top at 4.500p over the next 1-2 months. Indeed, at this stage any dips back towards the 10 day moving average at 3,641p are regarded as buying opportunities.
Comments (0)