Themed Watchlist 2

Growing up, as I did, in London, I can count the number of times we had a White Christmas on one hand. There have been a few in recent years and apparently Ladbrokes have odds on a White Xmas at 4/1, and have cut the odds of a minimum temp of -16°C. So, given the theme of my watchlist is based on info from the Met Office about the next two years, what can we do with the information that Ladbrokes have shortened the odds?
Well they are a business and it wouldn’t be a surprise if they tighten the odds each October/November to attract more bets. I suspect the news is intended to make people think it’s suddenly become more likely for some reason. Well there is a report from AccuWeather that Atlantic water temperatures this year (Jan-Aug) have been the lowest for 80 years, which is the short dataset they have. It sounds reasonable and that could be a factor. However the Met Office report suggests we’re facing down the two hottest years on record. But that is of course a reason to make the odds longer, not shorter!
So I’ve gotten hold of some weather data for London – harder than you might think by the way. The Met Office wants to charge an arm and a leg for such info. That’s outrageous. Even for simple data that is published in the daily papers, like max/min temp and whether it was sunny/rainy/etc. Stock market price histories are available for free but weather data is jealously guarded. Why? So we can’t see how wrong the weather forecast is? Someone suggested to me that it might be so people can’t easily fake insurance claims as weather is a factor you’ll remember when something did happen but not when you’re making it up.
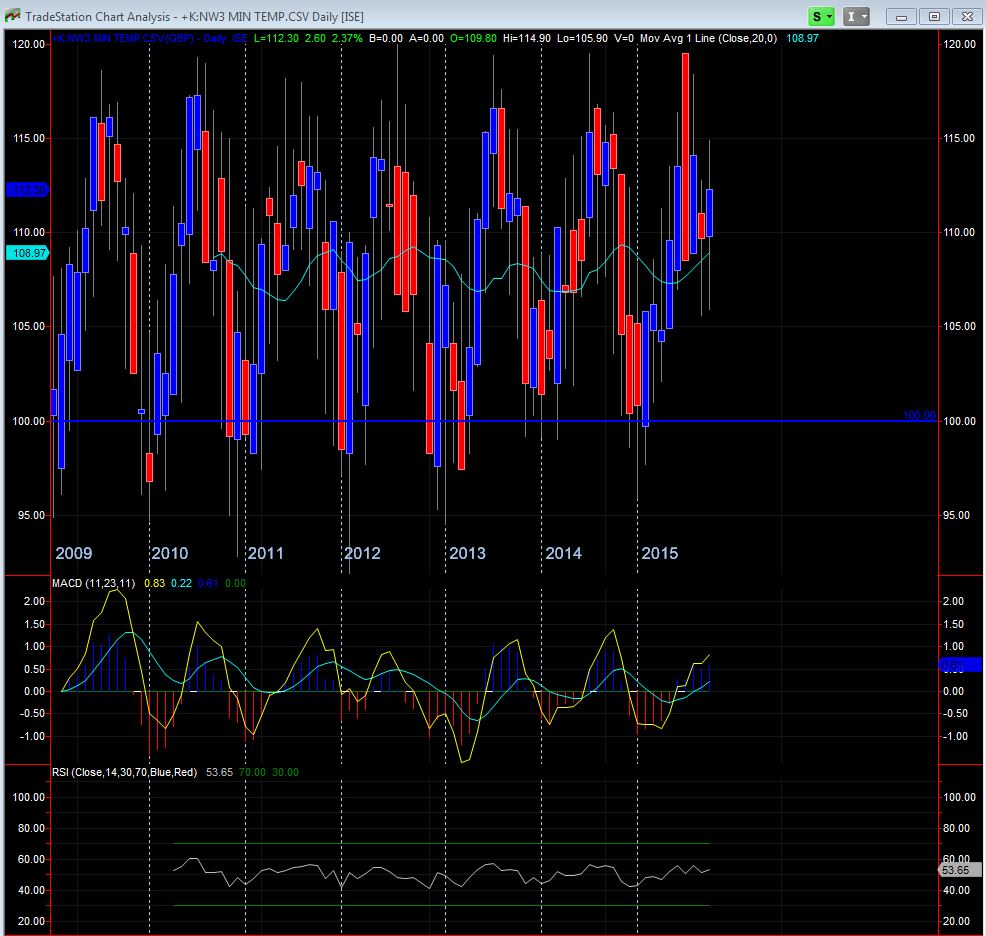
So, me being me, I’ve done some TA on London weather for the years 2009-2015. I’ve taken the monthly max and min of the minimum temperatures for each month, used the mean of these values on the first and last day of the month for opening and closing prices. Then I’ve added 100 to each of the values as candlesticks charts as other indicators don’t work too well when negative values are involved. I’ve marked the 100 line, which is really zero, and also a dashed line vertically for each January candle. Ok it’s not the world’s best dataset but it is enough to make some analysis. First thing I notice is that if we were expecting a cold winter then we’d have already seen the MACD topping out. We haven’t seen that at all. October isn’t over yet but at the moment it looks quite bullish going into November. If this was a stock I wouldn’t be about to short it. We have a blue candle with a reasonable sized body this month with 10 days to go.
Now, I’m not saying it won’t be a cold winter, but I am saying the probability from my analysis is that here in the South East it’ll be a fairly mild one, so I wouldn’t want to bet against that. We have nothing to add to our watchlist at this point, but this is the sort of analysis we need to do. It could have challenged, or enhanced, our stance on next year being very hot. I’ll probably have a closer look over the weekend at the daily weather data and see if that gives any signals, but as we stand it might be an idea to book your skiing holiday somewhere with some dry slopes!

Comments (0)