Runaway Rally Stocks

The ideal scenario as far as most of our portfolios are concerned is that they were sporting stocks whose charts were in persistent uptrends. On this basis we could simply sit back and enjoy the ride for months – or even years. Indeed, it is very often the case that when one looks at the main holdings of a star fund manager, you will see situations such as the charts shown below. The problem for us mere mortals tends to be that very often as soon as we spot what should be a runaway move, the move has a nasty tendency of running out of steam. But at least from a technical perspective there are some relatively reliable charting characteristics to look out for and these will be investigated via some of the strongest looking equities situations of the moment.
First up, and one of the best examples of a runaway move in a high profile group is “Always Fresh. Always Tasty” bakery chain Greggs (GRG). Here we can see on the daily chart the way that there has been a rising trend channel ruling the roost since December. Since then there have also been two unfilled gaps to the upside, something which is only seen in the most robust of situations. Indeed, the rule that gaps come in threes would suggest that even after all the gains there could still be a buying climax jump over the near term. Overall, the initial April floor of 999p looks to be a decent end of day close stop loss as we await a target as high as the late 2014 resistance line projection at 1,220p. The timeframe on such a move is seen as being as soon as the next 1-2 months. At this stage only sustained price action back below the 50 day moving average now at 919p is regarded as being outright negative.

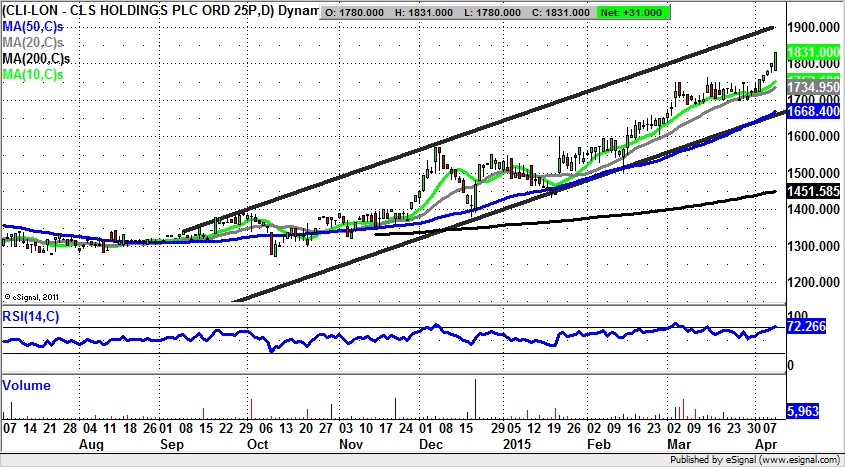
For CLS Holdings (CLI), the rally here has been in place a little longer than Greggs in terms of the golden cross buy signal between the 50 day and 200 day moving averages at the end of September. This was the month when the rising trend channel which has pulled the stock higher was formed. The most impressive technical event since then is an unfilled gap to the upside through the 50 day moving average and 1,500p in January. This is the type of signal which can really light a fire under a rally, and this is exactly what we have seen subsequently. Indeed, since the beginning of February new support has been coming in for CLS Holdings above former resistance. The implication of the latest extended bull flag formation is that provided the shares remain above the 20 day moving average at 1,715p the upside for this situation could be as great as 1,900p at the 2014 resistance line as soon as the end of April.
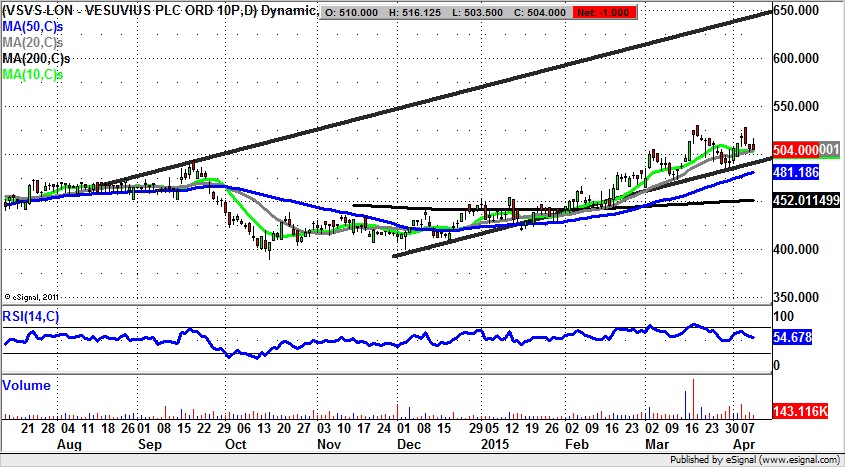
Vesuvius (VSVS) is a situation where we not only have a golden cross buy signal between the 50 day and 200 day moving averages for the start of March, but also the initial unfilled gap to the upside last month. The floor of this gap is at 483p, with the failure to fill it later in the month amounting to one of the strongest buy signals in the charting book. On this basis one can say that while there is no end of day close back below last month’s gap we can call shares of Vesuvius up to the top of a rising trend channel from August. This has its resistance line towards 650p, and one would take the view it could be hit by the end of May – given the quality of the charting set up here.
Comments (0)