Mid Caps Focus: JD Sports, Kaz Minerals, Ophir Energy

Whether you prefer to stick to the blue chips or not, something which can clearly be an advantage as far as following the second line UK stocks is the way that on a day to day basis there tends to be much less volatility in this space due to macro economic or geopolitical worries. Of course, if you believe the theories of Our Dave, then the five years of the Coalition Government have ensured that it has been a boom time for many UK focused companies, something which tends to boost the domestically focused FTSE 250 zone. To “celebrate” this notion I am looking at some of the stand out situations from this area from a technical perspective.
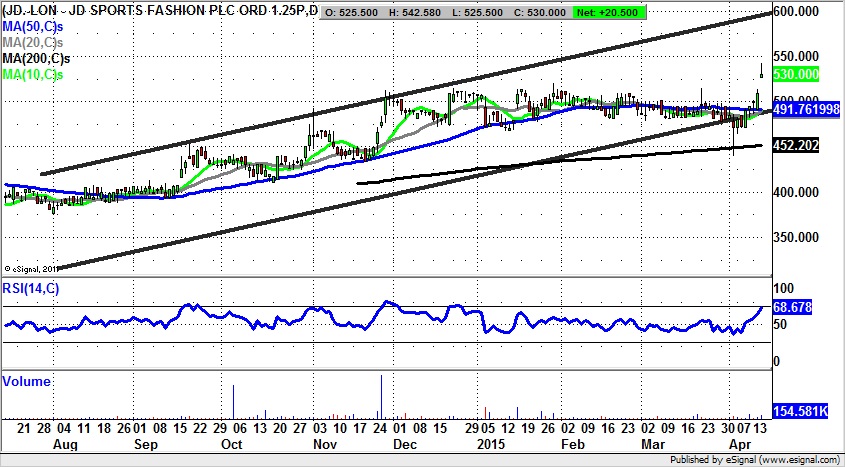
First up is JD Sports Fashion (JD.) where the latest phase of the bull run began with a gap to the upside above the 200 day moving average then at close to the 400p level. This feature is now up to the 452p level and was tested briefly intraday to start April. This one touch manoeuvre is a classic bull signal, and has certainly done the trick in terms of adding fresh momentum to the overall rally. Indeed, with the latest gap to the upside we should be confident that shares of JD Sports Fashion will be able to stretch towards the implied technical target on the daily chart. This would be the top of a rising trend channel from August at 600p, and would be valid while there is no end of day close back below today’s gap floor at 514p. The timeframe on such a move is regarded as being the next 4-6 weeks.
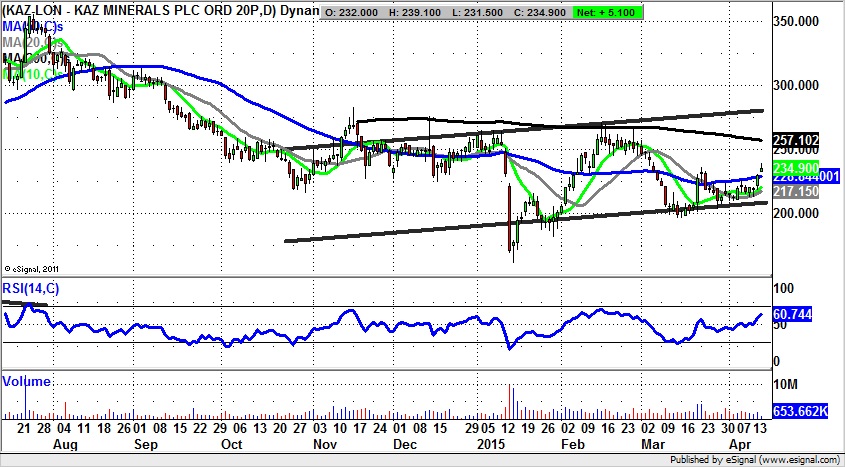
A rocky ride is perhaps the most fair description of what we have been seeing on the daily chart of Kaz Minerals (KAZ) in the recent past. This is said on the basis of the often wild gyrations within a rising trend channel from October. The charting highlight in the near term is the way that the shares have just gapped through the 50 day moving average at 228p. This provides technical traders with a useful opportunity to go with the gap to the upside and employ an end of day close stop loss back below the 50 day line. The notional upside while the 50 day line is held is as high as the 2014 resistance line projection currently running at 280p, a target which could be hit as soon as the end of May.
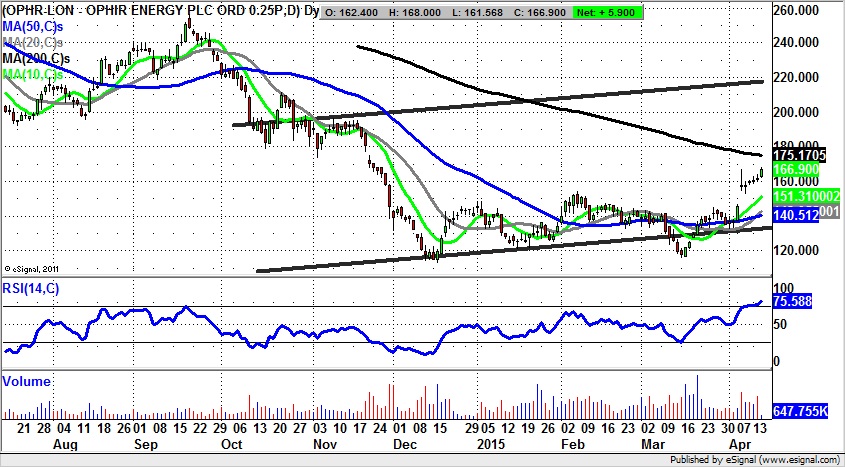
Few would deny that much of the past year for shares of Ophir Energy (OPHR) has been a rather unpleasant experience, a point which is underlined by the way that there has been an extended period of consolidation required in the wake of the September-December breakdown for the shares. That this process looks to have been completed is evident from the way that since March we have been treated to two unfilled gaps to the upside. The latest gap for April has been followed by a bull flag above the gap, and a golden cross buy signal between the 20 and 50 day moving averages. The conclusion to draw now is that while there is no end of day close back below the top of the latest gap at 154p, we could see a significant move to the upside. The favoured destination is the top of a rising October price channel at 220p over the next 1-2 months. Only cautious traders would wait on a clearance of the 200 day moving average at 175p before taking the plunge on the upside.
Comments (0)