G4S (GFS): Gap through 50 day line targets 280p

It would appear that the market was loath to let G4S off for its historical mishaps on the fundamental front, with this misery reaching its peak at the time of the London Olympics in 2012. However, from a charting perspective at least, it would appear that things are looking up.
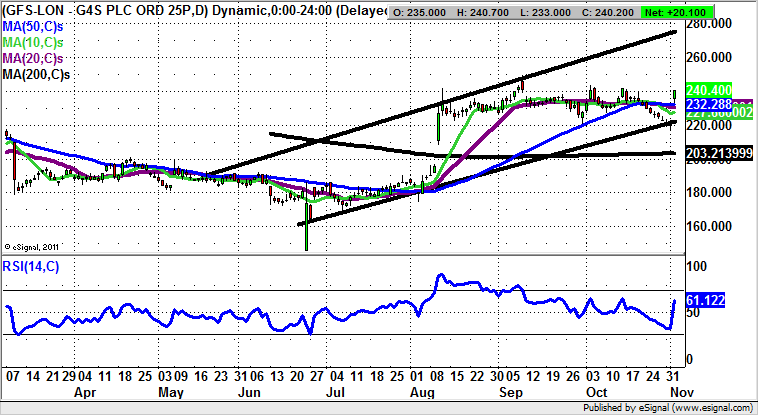
It can be seen from the daily chart that this has been an improving situation chart wise since the time of the post-Referendum sell off at the end of June. That proved to be a final bear trap dip, and we have seen significant positive charting events to counteract the persistent negativity surrounding the company. For instance, August witnessed an as yet unfilled gap to the upside through the 200 day moving average, a clear trend-changing move for the bulls. This gap remains unfilled and has been added to by the latest unfilled gap through the 50 day moving average, now at 232p.
The message now is that provided there is no end of day close back below the 50 day line level, we would expect to see acceleration to the upside and a notional 280p target. This target is at the top of a rising trend channel which can be drawn from as long ago as May. At this stage only a weekly close back below the May support line would suggest we shall not see the technical target hit by the end of 2016.

Comments (0)