European markets and the FTSE

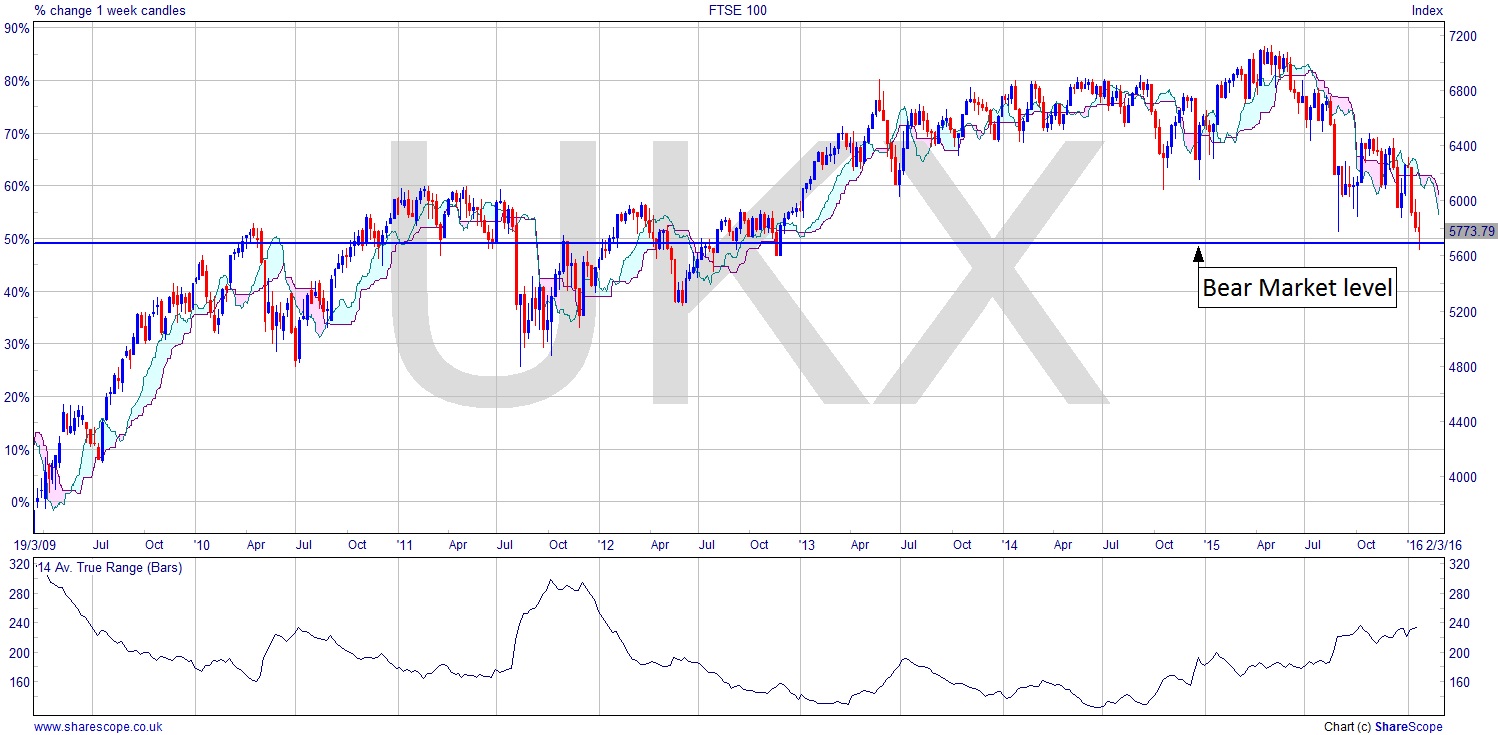
In my last post I looked at the Dow Jones. The US economy and markets are stronger than the UK. The important thing about the market there is that it has not reached the level to be termed a Bear Market. The FTSE 100, however, has. It pushed through that level and closed below it on Wednesday. As I write it looks like we will finish the week above that level but towards the lower end of the previous week’s bar, and on the daily the candle for Friday is an inside day (the candle’s range is smaller than the previous candle and the high and low are contained within the previous candle’s range). That is not what you’d expect a recovery to look like.
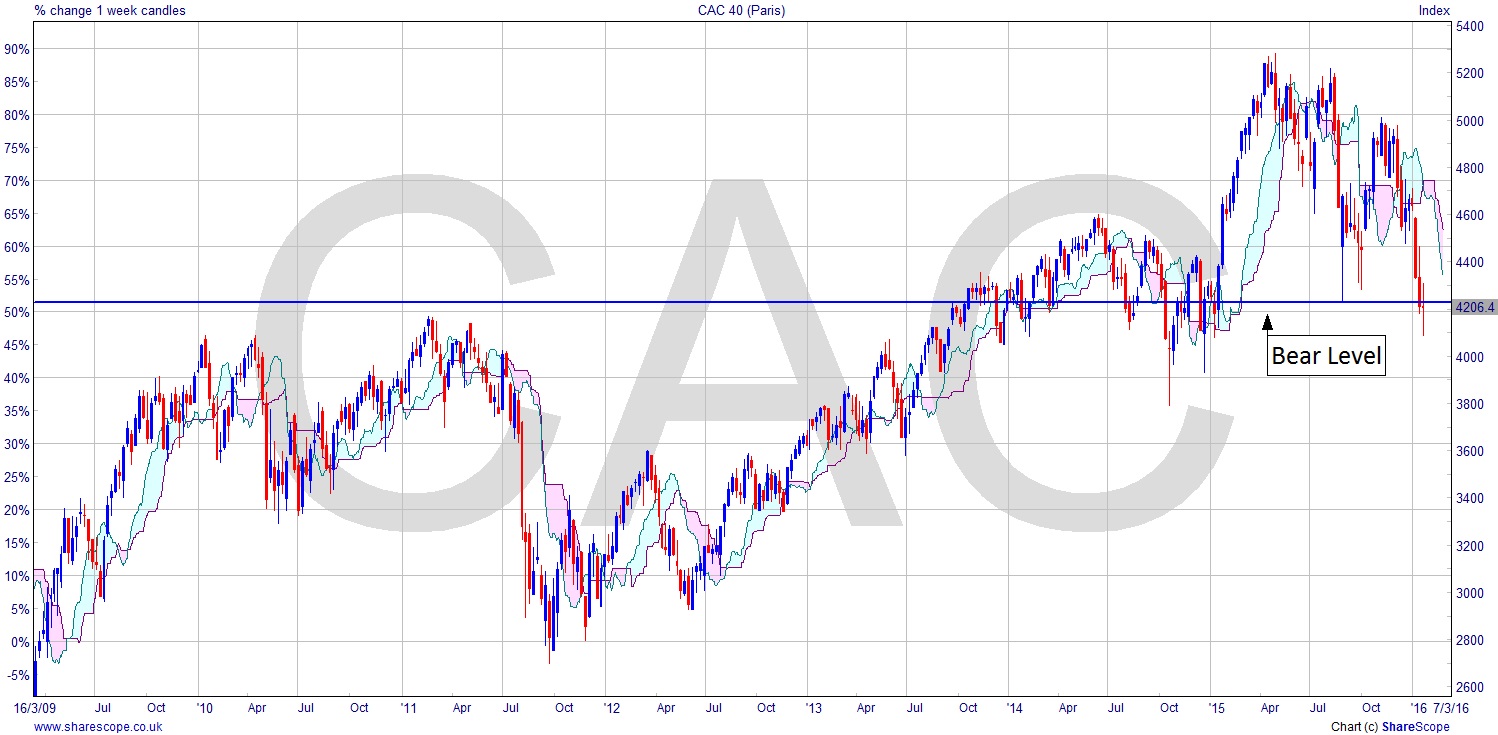
The FTSE now has a different complexion than the Dow. The question is does it follow suit with the likes of the CAC – which technically went into a Bear Market last week – or will it find encouragement from the US markets, which are still relatively bullish? France is in a “state of emergency” economically speaking. There’s no chance of anything filtering into the markets from good economic results for at least 6 months.
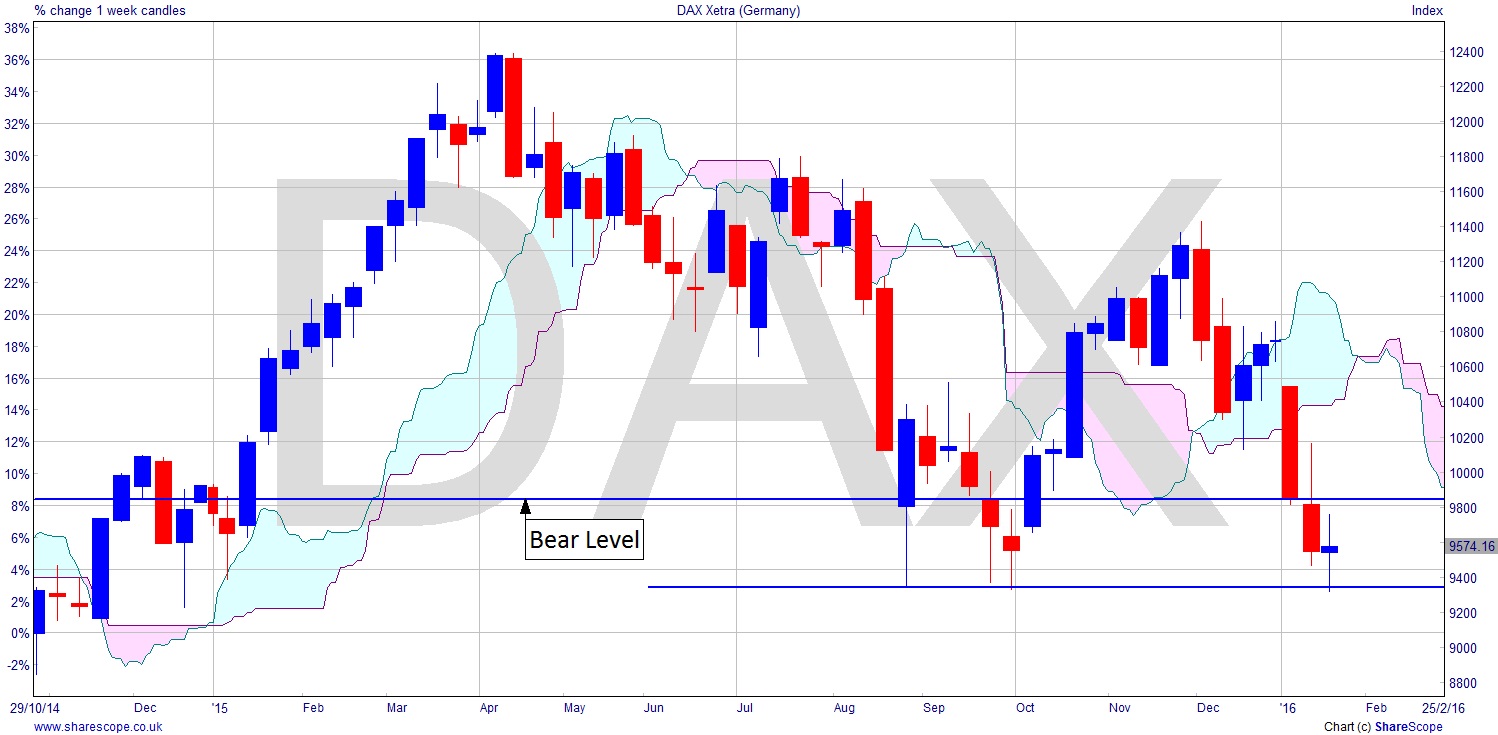
The DAX is a little different. It’s a similar looking chart to the FTSE and CAC but it has already been in bear territory and is once again. Could this be the leading chart for the EU? There’s clear support just below the Bear level at around 9350, but a fall through that and things would look very bearish indeed.
Why aren’t we hearing the term Bear Market? Doesn’t it suit the narrative of the media to say it? Most of the time they’re exaggerating reality, not ignoring it!
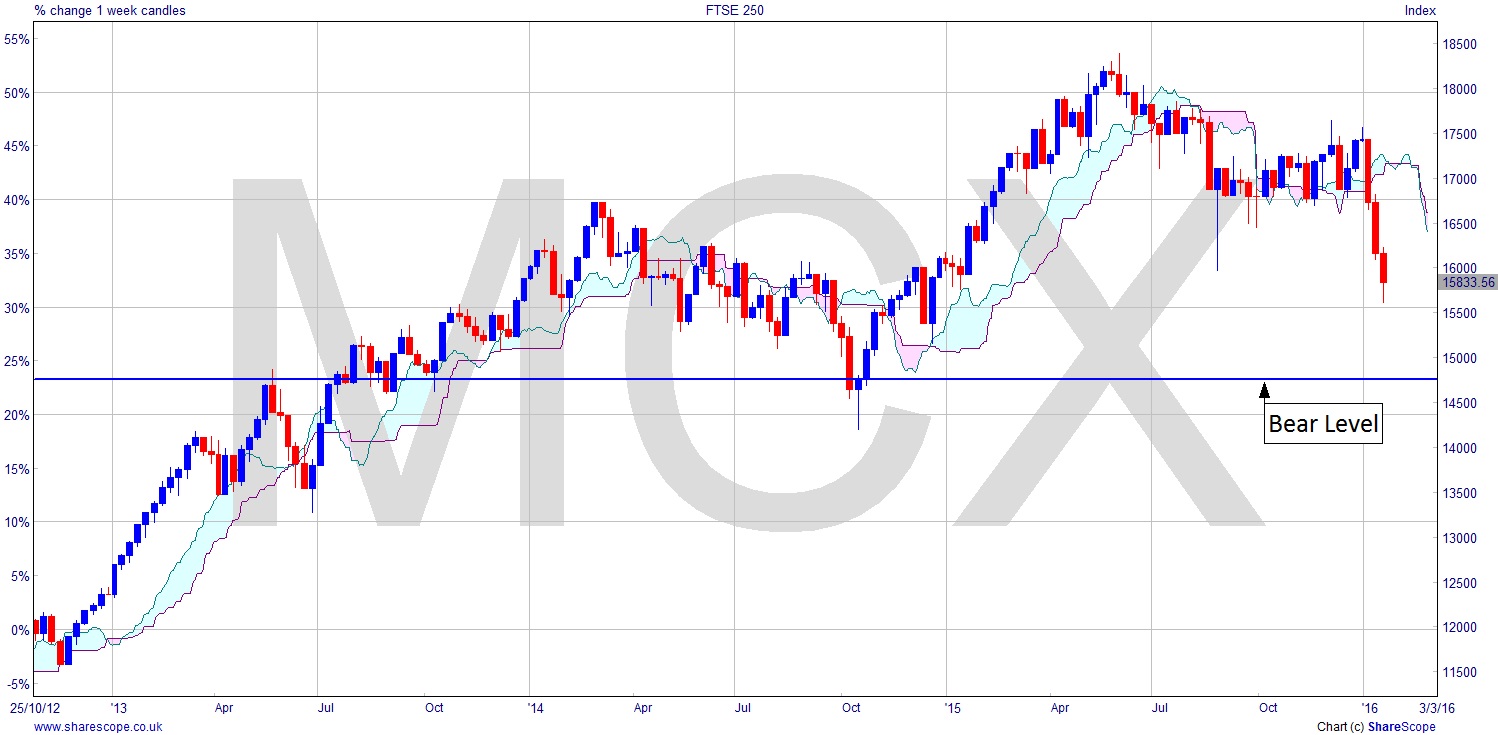
It’s often useful to look at some other markets that may give us more of a leading edge. The FTSE 100 is not the most balanced of indices. It’s full of the best performing stocks and tends to be over-exposed in some sectors, like Mining for example. The FTSE 250, however, is much broader in its composition. Interestingly, it hasn’t fallen to its Bear level. It does look weak though, and it’s not quite as well buffered as the Dow, where this last fall hasn’t been as low as the one last autumn.
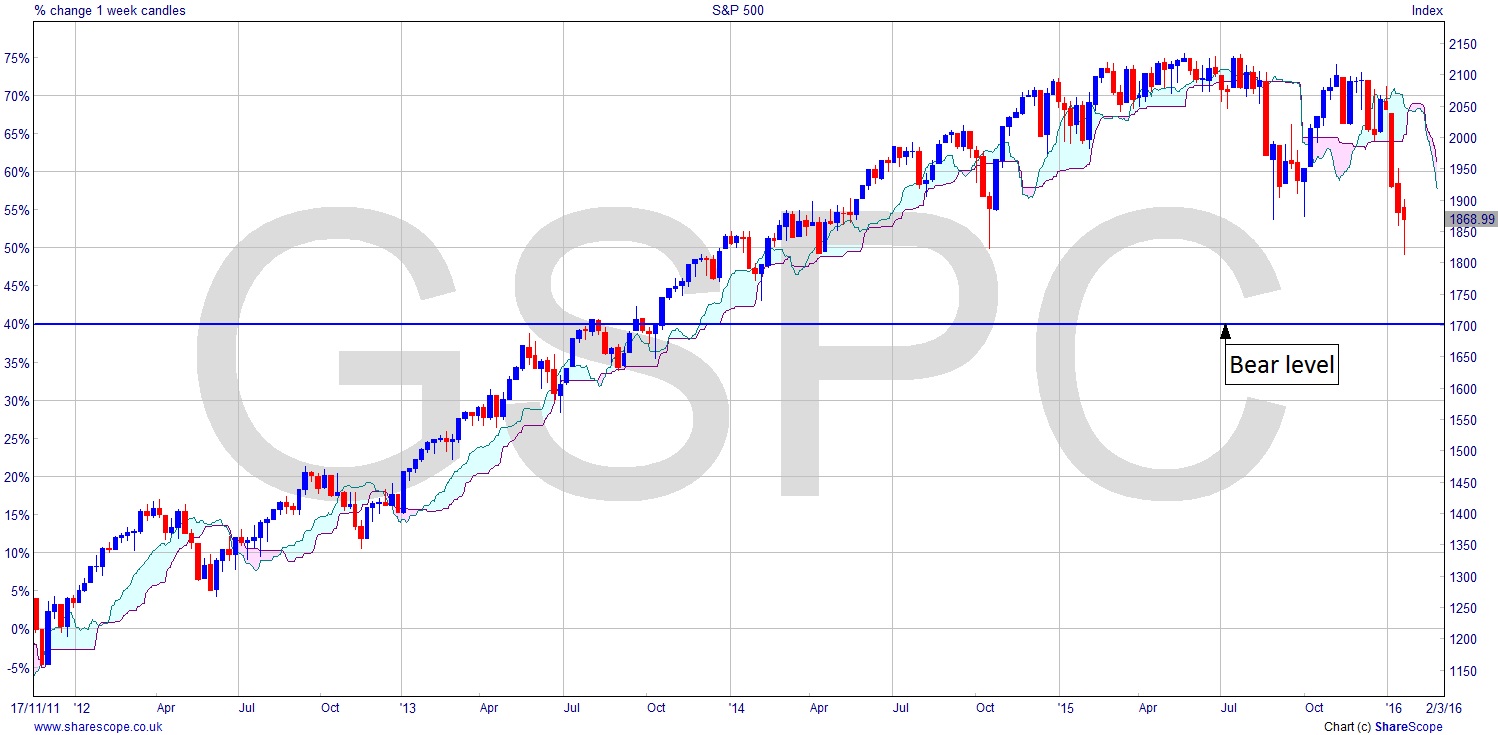
The S&P 500 is a broader index than the Dow and that has made a lower bottom than last autumn, but it’s a good way above the Bear level. The NASDAQ looks much the same, and it can usually be considered the leading index as it represents a lot of hot air (i.e. tech companies) and investment is more speculative for that reason, and thus more fluid.
We appear to be in a time of flux in the sense that we’ll almost certainly see moves down, but this whole market cycle since 2009 has been slow and leisurely. So, sit back, relax and be prepared. A lengthy range-bound chart provides the opportunity for a measured move, which will be easier to read if it plays out that way than what we’re presented with today.
Comments (0)