Aggressive Trades – Low-Risk Trade Management (Part 4)
")
Over the last few posts I’ve talked about entering and exiting trades and started on a worked example in the last post. It’s an aggressive trading stance but with tight risk management, which may sound a contradiction in terms, but it’s not. So continuing directly from there…
Assuming we closed the position, and I’ve marked open positions either with ½ or 1 denoting a half or full position, or with 0 denoting a closed position, then we are awaiting another entry signal. The price trades off underneath the £30 resistance level again. It’s still never managed to become support at this point. However we have had a series of higher lows here and it’s gotten closer to breaking properly above £30 at each attempt. Resistance must be getting weaker as the tree has been shaken a number of times now, meaning worried market participants should all have turned tail by this point. As a result we’d expect it to succeed on the next attempt.
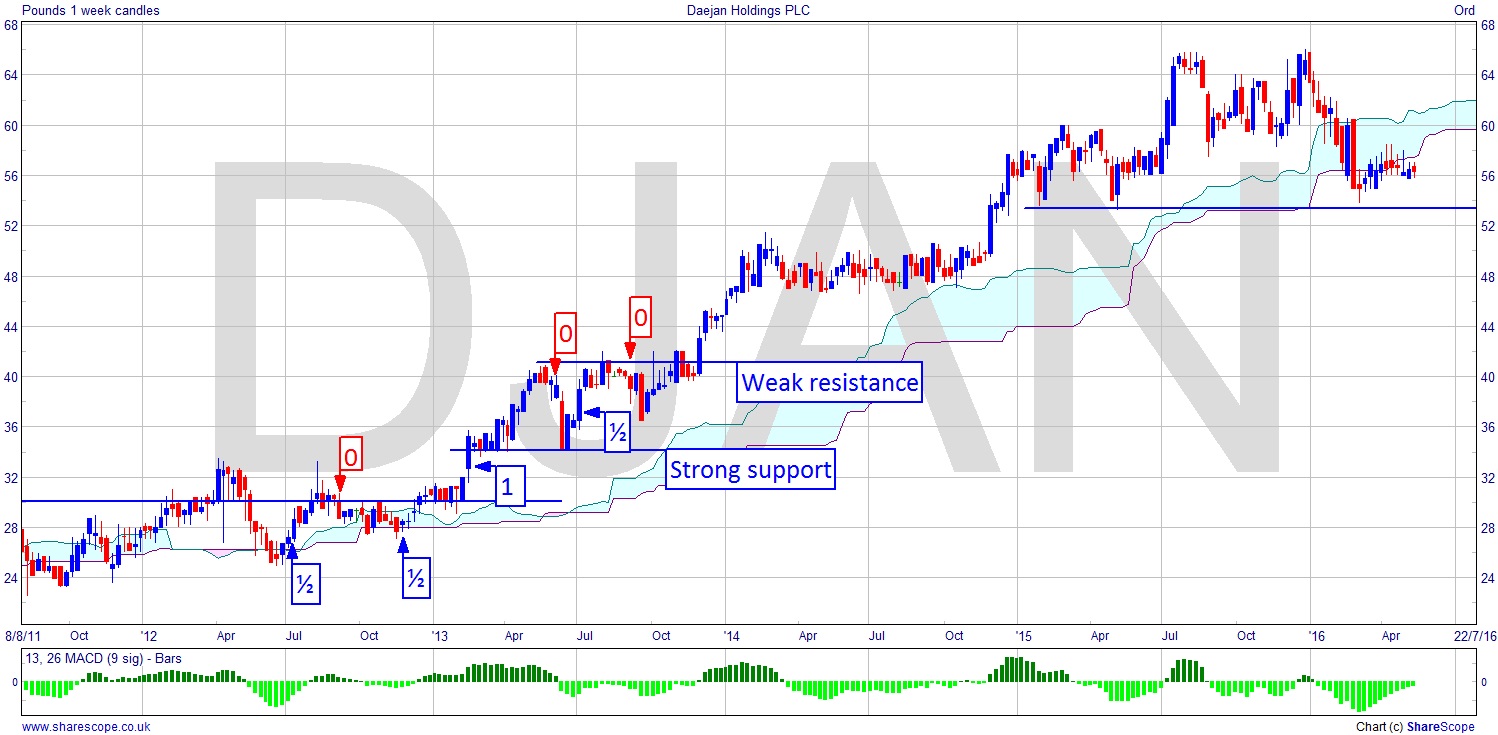
One thing we know about Ichimoku clouds is they tend to be crossed when entered. In other words if the price starts to move across them from top to bottom (or v.v.) then it will most often touch the other side at least. Knowing this and with a higher low on the MACD histogram In Oct/Nov ’12 we can take a similar entry with a half position the second time the price fails to drop out of the cloud. We’re confident that it should move to the top. A tight stop and we have very little risk here. Entry say £30.50, should have been easy enough. After that it’s plain sailing for the half position. We see a congestion area just above the £30 resistance level. There are a couple of ways to get the other half position on. Once it closes at £32 we can take another half at around £32.50. (We’d probably have got much better fills at the time so I’m erring on the side of caution for evaluating the success of the trade).
The next part really depends on your risk profile. Once it begins to fail at £40 it would be quite reasonable to take half or all of the position off. I expect I’d have taken half off then tightened the stop on the remaining half to around £38 – so each half around 800 points or 25% up, depending on whether it was a spread bet/CFD or an actual stock purchase. Either way we can certainly justify another entry after the support level at £34 works so well. Another higher low. Probably a half position which would then inevitably have a very tight stop approaching the resistance level at £41/42. Even at £39 that’s 500 points/14%. It’s weak resistance, incidentally, because each time the price challenges it breaks a little higher than the previous time.
We could justify taking a half position at the higher low. Remember this chart has been littered with higher lows that have played out. If a chart has a character, then take advantage of it. We know there’s resistance at £41 so that’s our interim target, but more so a decision point. We know we have to manage the trade there. Once it starts to create a congestion area beneath that resistance we can move the stop in close. Probably close to £40. And so on and so on. This is a chart with which you can just keep doing the same thing. Where we see the change is in the last few months where we have lower highs. The stock first tipped its hand that a change was imminent with the lower high between the two tops at the ATH. In the next post I’ll give my thoughts on the chart as we stand.
Comments (0)