Chart of the Day: UK Oil & Gas

Horse Hill has been such an epic story of billions of barrels, ramping, counter ramping, and intrigue that one would consider the whole situation as being a little too exciting for most small cap punters. Nevertheless, at least the charting position at UKOG looks to be improving.
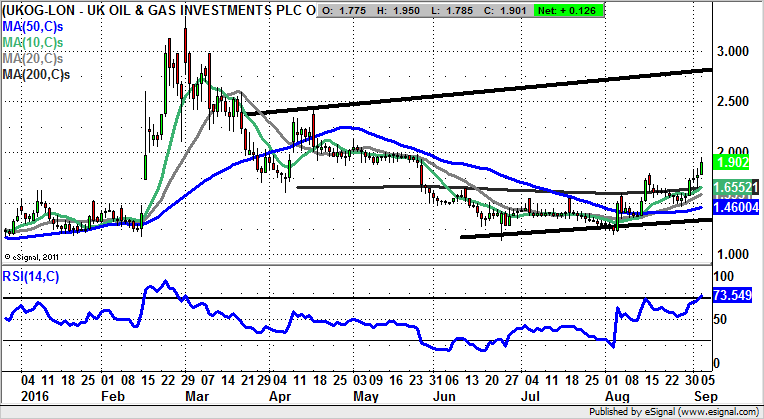
UK Oil & Gas (UKOG): 2.75p 2016 Resistance Line Target
Clearly, from a charting perspective, the killer blow in the near term was the decline from March’s 3p peak to under 1.25p in June. The upset on this front has to be that if the fundamentals here are so good, the volatility and sell offs should not be so severe. However, it can be seen that since June and the Brexit vote dip we have been treated to a very constructive charting phase. This has consisted of higher lows and highs, plus the clearance of the 200 day moving average at 1.65p. Indeed, all the near term moving averages are currently rising, something which is especially telling given the way we are trading in the aftermath of what was a considerable break to the downside earlier this year. The view now is that the shares are likely to head for the top of a rising trend channel from April, with its resistance line projection currently heading as high as 2.75p. This target could be hit as soon as the next 4-6 weeks, especially while there is no break back below the rising 200 day line. In the meantime, any dips towards the 200 day line are regarded as buying opportunities.
Comments (0)