Using market momentum to limit the impact of market crashes

By Glenn Martin
This is the fourth in a series of seven articles drawn from my new book, 7 Successful Stock Market Strategies. The focus of these strategies is successful long-term UK equity investment.
In this article I explain a technique for limiting the impact of market crashes. The technique uses market momentum, which measures the trend of the market, either up or down. The momentum is identified by moving price averages, which smooth the daily price fluctuations. For example, the 100 day moving average is the simple unweighted average of the closing prices over the last 100 trading days. It is unweighted because each of the 100 prices has an equal weighting in calculating the average.
This technique uses moving averages for both 100 and 200 days. These moving averages can be charted, as shown in the example below. The jagged lines are the daily fluctuations in price of the FTSE 100 and the smooth lines are the moving averages. Where the moving averages cross, these points can be used as trigger points in a market momentum system. When the 100 day moving average crosses below the 200 day moving average, this is an indication that the market is trending down. When the 100 day moving average crosses above the 200 day moving average, this is an indication that the market is trending upwards.
The technique uses the following steps:
- Note the market closing price when the 100 day moving average crosses below the 200 day moving average.
- Calculate 90% of this price.
- As soon as the market falls to or below this price, and before the 100 day moving average starts moving up again, exit the market. Note that this occurrence happens very rarely. At the time of writing, there have only been 3 occurrences since the FTSE 100 started in 1984.
- If the 90% market exit trigger has occurred, re-enter the market when the 100 day moving average rises above the 200 day moving average.
You do not have to chart the moving averages yourself, as free services such as Digital Look will provide moving average charts to your own specification. My book explains in detail how to use the Digital Lock moving average charting system.
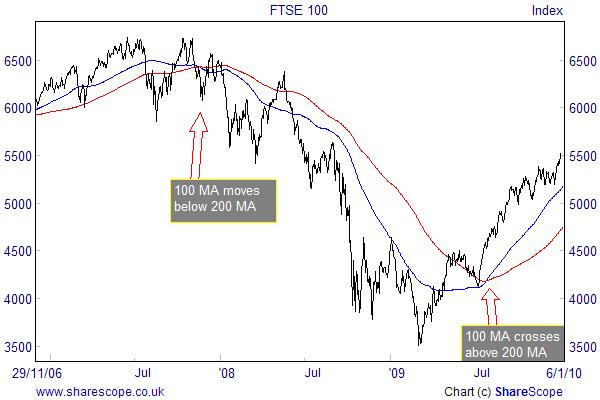
The chart below of the 2007/8 credit crunch crash shows the technique in action:
- The 100 day moving average crosses below the 200 day moving average on 15 November 2007, when the closing FTSE 100 price is 6359.6.
- 90% of this price is 5723.6.
- The FTSE 100 falls to or below this price on 21 January 2008, when the 100 day moving average is still falling and the closing price is 5578.2. At this point you exit the market.
- The 100 day moving average rises above the 200 day moving average on 28 July 2009, when the closing price is 4528.8. At this price you re-enter the market.
The net effect of this strategy is that you have sold at 5578.2 and re-entered the market at a cheaper price, for 4528.8. You have therefore avoided 1049.4 points (5578.2 less 4528.8) of the market crash. This means that you have increased the capital value of your fund by 23.2% compared with sitting on your hands ((5578.2/4528.8) x 100) -100. For the period out of the market, you do not receive dividends but you do get interest on the cash, providing you invest it in an instant-access deposit account. The net effect in this example (approximately 5.5%) does not nullify the benefit of the technique.
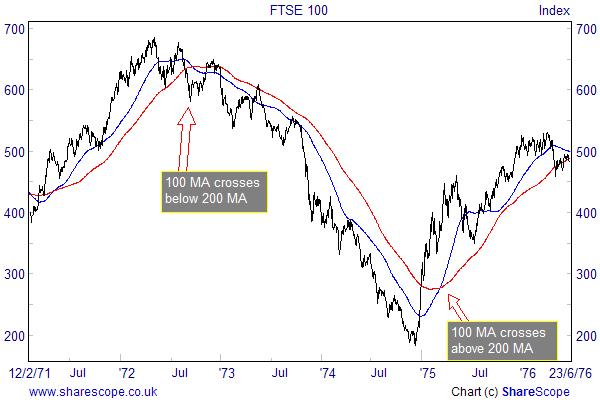
A second example of the technique is taken from the 1970s, when the UK stock market crashed by more than 72%. This is considerably greater than any crash which has occurred since the inception of the FTSE 100 in 1984. Although the FTSE 100 index did not exist in the 1970s, there were other UK stock market indices. ShareScope provides a continuous time series of the UK stock market prices since 1962. The market peaked at 684.5 on 3 May 1972 and crashed to a low of 188.9 on 18 November 1974, an overall crash of 72.4%.
You can see from the chart below that this technique would have protected you from the full impact of this cataclysmic crash:
- The 100 day moving average falls below the 200 day moving average on 19 September 1972, when the closing price was 611.
- 90% of this price is 550.
- The price falls to 544.6 on 13 February 1973, when you exit the market.
- The 100 day moving average rises above the 200 day moving average on 10 March 1975, when the price is 373.5. You re-enter the market at this price.
The net effect of this strategy is that you have sold at 544.6 and re-entered the market at 373.5. This means that you would have increased the capital value of your fund by 45.8%, compared with sitting on your hands ((544.6/373.5) x100)-100. The net effect of dividends foregone less interest received would not negate the enormous capital benefit of this technique.
To purchase 7 Successful Stock Market Strategies by Glenn for the special Master Investor price of £17.50 + P&P (RRP £24.99) for the paperback and £10.50 (RRP £14.99) for the ebook use the following promotional code when checking out at the Harriman House online bookshop: MASTER7SSMS.
Comments (0)