Zak’s Daily Round-Up: ANTO, SPD, ITM and SML

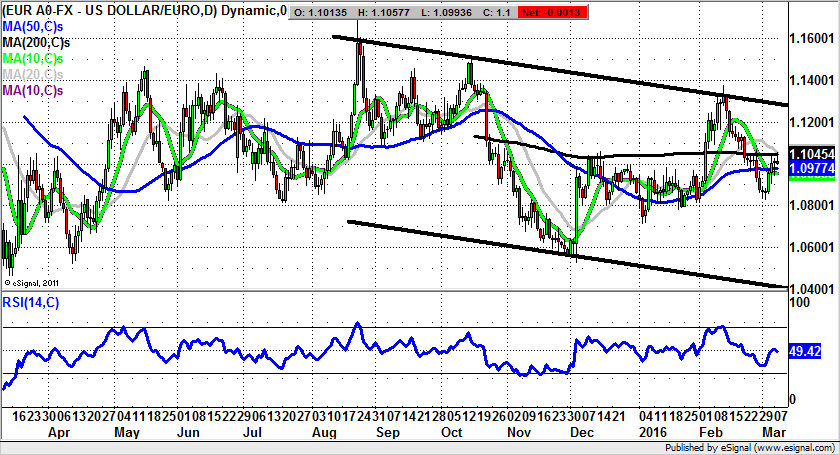
Market Position: Euro/Dollar Likely Top towards $1.1050
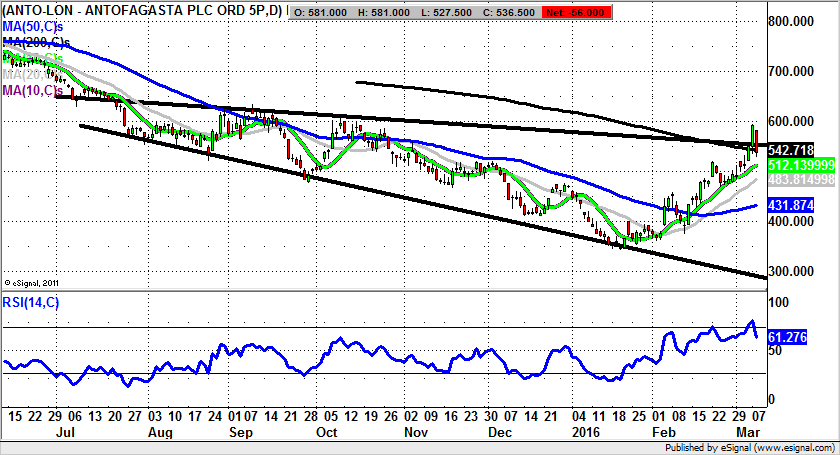
Antofagasta (ANTO): Initial 200 Day Line Bull Trap
It may be said without fear of contradiction, that the stocks which have been hauled in today are very much the more difficult of their respective classes. In the case of Antofagasta we are looking at a situation where we are seeing the stock trading in the wake of an initial bull trap failure at the 200 day moving average at 642p. All of this of course comes in the wake of a couple of rather significant fundamental triggers. The first is the way that Chinese exports for February were down 25%, a massive figure by any standards, and much more than the consensus call of 15%. While there is a marginal excuse – of the “dog ate my homework” variety, in the form of the Chinese New Year, the overall problem here would appear to be that the world’s second largest economy is simply falling off a cliff. The PBOC and Chinese authorities may huff and puff, but in the end there appears to be little to stop their economic house of cards falling down. This of course makes things rather painful for the mining sector. The implication is that even if the start of 2016 stock market sell off made valuations for the likes of Antofagasta too cheap, and even if a rebound of sorts is warranted, the lack of demand from the sector’s biggest customer – China – makes it difficult to call the sector up too high. Indeed, while it may be the case that the latest rally is justified, as too much negativity was factored in, without the oxygen of Chinese demand, it is difficult to work out where the fresh share price drivers may be derived from. Looking at the daily chart configuration of the Chile focused Copper miner, it can be seen how there has been a pullback from the top of a falling broadening triangle, one which has been in place since as long ago as the post July period. As far as the latest price action is concerned, it can be seen how there has been a failure at the top of the triangle at 555p. The message at the moment is that provided there is no end of day close back above the 2015 resistance line, there is the risk of a test for support towards the 10 day moving average at 512p—where buying interest may come in. That said, the stop loss on any positions take towards this technical feature would be an end of day close back below the 20 day moving average at 483p. The target while above the 20 day line is the recent 600p zone resistance on a one month timeframe.
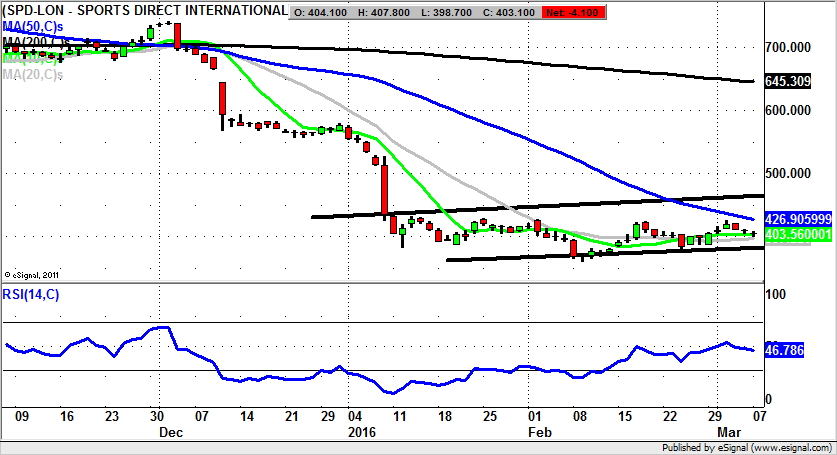
Sports Direct (SPD): Risk of Fresh Downside below 50 Day Line
Sports Direct is a company which seems to have been spattered with a fair collection of problems that one would suggest are only seen in the most “colourful” of stock market situations. This may explain why it has been mooted that the company should be taken private. The charting position here verges on the shocking for a FTSE 100 company, even within the context of modern day volatility and sentiment swings. The best description of what is going on currently is that we are looking at an extended consolidation below the 50 day moving average at 423p. In theory there is a decent chance that this may be a recovery play, at least on an intermediate basis. The problem though, is that while there is no end of day close back above the 50 day moving average at 423p there is still the risk of a retest of the February 359p intraday low over the next 4-6 weeks. This is particularly the case given the latest end of day close back below the 10 day moving average at 403p.
Small Caps Focus
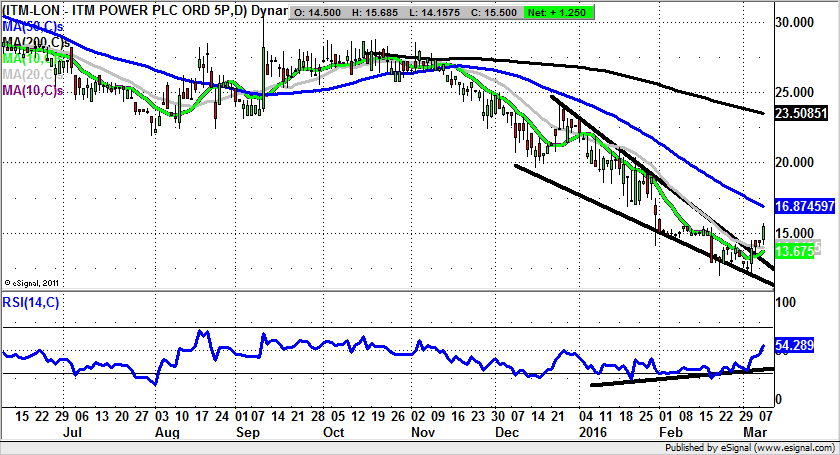
ITM Power (ITM): Back to Former 20p Zone Support
As can be seen from the current chart configuration of ITM Power, we have been looking at quite a few bruising months for bulls of the stock. The only real plus point here has been the way a falling wedge reversal has unfolded, with the resistance line break at 13p kicking off March. Since then the move higher appears sharp, and even sustainable. This is especially the case while there is no end of day close back below the 10 day moving average now at 13.67p. The ideal scenario is that while the 10 day line is held the stock will at least revisit what was formerly support in December just below 20p. The timeframe on such a move is regarded as being the next 1-2 months. Only cautious traders should wait on a clearance of the 50 day moving average now at 16.87p before taking the plunge on the upside, even though the break of the RSI above neutral 50 to stand at 54 is a leading indicator on bullishness.
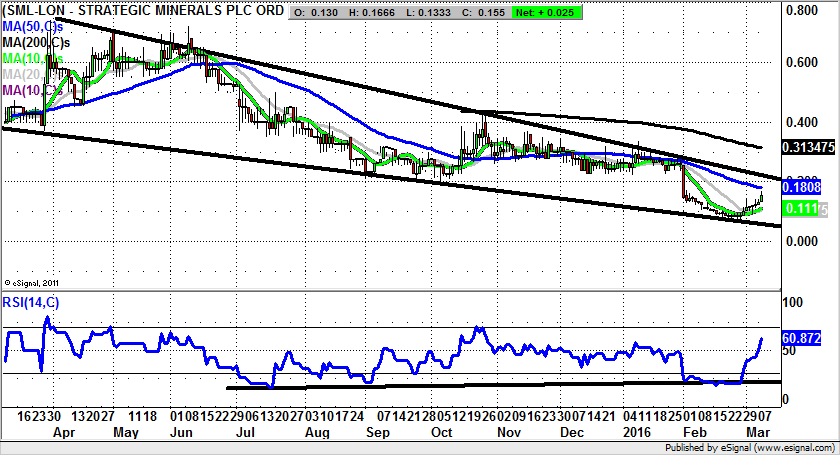
Strategic Minerals (SML): Falling Wedge Reversal Could Lead To 0.4p
It would appear that there are plenty of private investors out there who are simply willing shares of Strategic Minerals higher, especially after the painful decline witnessed between June last year, and February this year. In particular, the last leg down from 0.25p plus to below 0.1p last month did appear to be particularly cruel. Nevertheless, the present setup with a one year falling wedge reversal pattern which has its resistance line running at 0.2p looks to be a decent ally of the bulls. On this basis one would suggest that there will at least be a push to the 0.2p 2015 resistance line. A weekly close back above this feature should be enough to unleash what could be a relatively explosive example of price action. The notional target in this respect would be the former October resistance at 0.4p over the next 2-3 months. In the meantime only cautious traders should wait until the wedge is cleared at 0.2p before pressing the buy button.
Comments (0)