Zak’s Weekend Chart Round-Up

FTSE 100 Stocks
Barratt Developments (BDEV): Initial Rebound Prospects
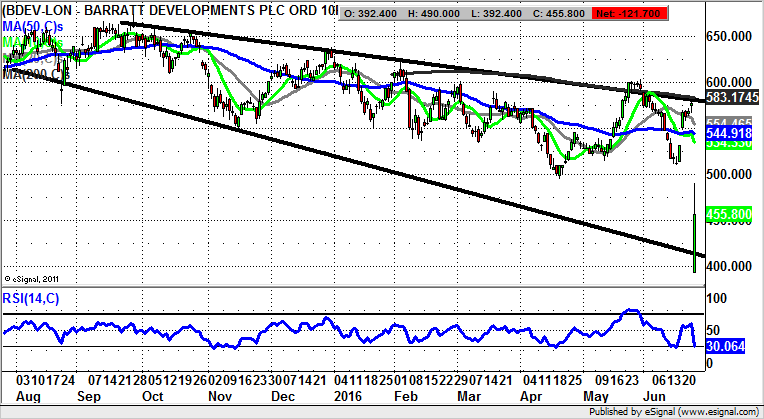
It is interesting that even though the housebuilders have enjoyed the benefits of zero interest rates and capital flight from the bust EU and elsewhere, the Brexit has really given them a painful initial mark down. This is surprising given the way that there is little sign that the housing crisis will ease, in fact, even UKIP is apparently pro immigration. So we should be looking at a dip to buy into for the likes of Barratt Developments, unless the effect of the “Buy to Forget” foreign investors leaving is that pronounced. Looking at the daily chart currently it can be seen how there has been a “power drill” reversal” such as I described with Chemring (CHG) earlier in the week. This consists of a gap to the downside where on that day the low is close to the open. Then for the rest of the session there is a gradual rebound. On this basis one would suggest that Barratt Developments can be regarded as a recovery play, especially while there is no end of day close back below a July support line projection, currently running at 420p. The potential upside is the former initial June support at 511p over the next 2-4 weeks, even if the stock then falls away again.
Barclays (BARC): 50 Day Line Target
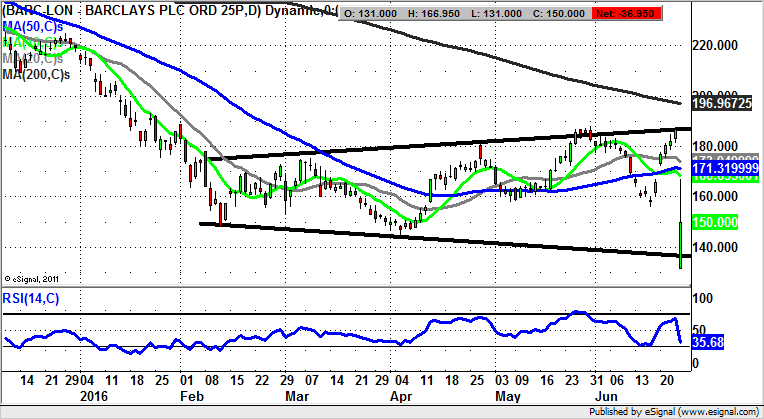
Like Barratt Developments described above, it can be seen on the daily chart of Barclays that this was a stock which opened at the low of the day and then rallied relatively well. In this case it can be seen how the shares have already climbed quite well from the 131p floor, and also managed to crawl back above the former intraday low of the year at 144p. This gives us a couple of decent points to trade against – yearly support and the 131p extreme overshoot of Friday’s open. Indeed, the assumption to make now is that provided there is no end of day close back below the 144p former low we can assume a decent push to the upside, if only of the dead cat bounce variety. As for how high any initial bounce may stretch, we are looking at the prospect of a retest of the 50 day moving average zone at 171p, some 5p above the printed intraday high of Friday. That said, even if the 50 day line is reached in any post Brexit squeeze, we would probably still favour a range to develop between 140p – 170p as much as anything else.
Lloyds Banking (LLOY): Key Initial 2016 Support
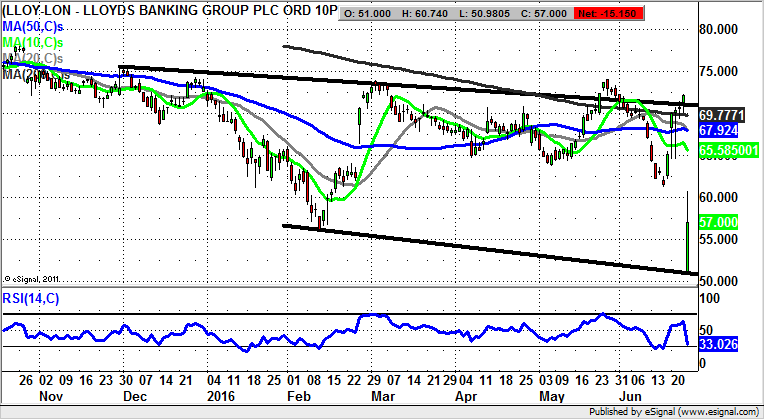
The big fundamental level on the Lloyds Banking daily chart is currently the same as the big technical level, given the way that 73p is the Government’s breakeven level on the whole bailout episode, which has seemingly gone on and on. Looking at the daily chart in recent months though, we have a situation where post March resistance feels like it is a long way away. Instead, we are forced to look at the downside, especially in the wake of today’s brief probe towards 50p. Presumably at this point the on/off attempt by HM Government to sell the rest of its stake in the Black Horse bank will be threatened yet again. But at least in terms of the price action over the near term we can consider that while there is no end of day close back below the former 56p February floor there is the chance of a retest of the low 60s area, which was formerly support on the way down. However, back below the initial 2016 support we run the risk of another run in with the 50p zone.
RBS (RBS): Risk of Fresh Sub 200p Probe
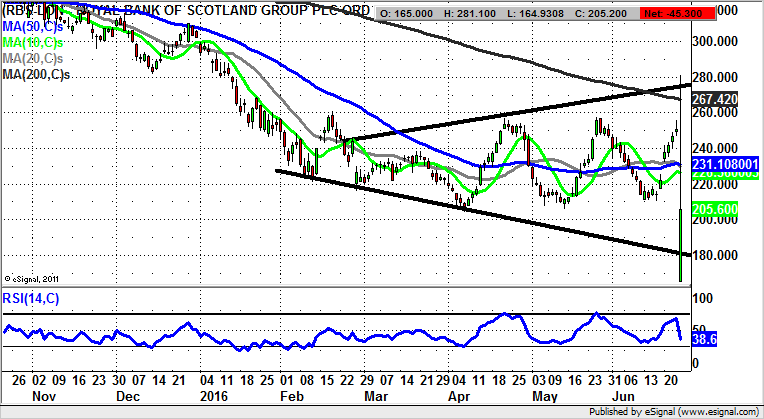
With the latest charting position at RBS we have a situation which mirrors what is evident on the daily chart of Lloyds Banking. Here there was the initial deep probe below 200p, which was a classic bottom fish / bargain hunting opportunity. However, the problem now is whether or not RBS shares have already done the best that they can do over the near term, having just recovered the former initial 204p 2016 support. The answer may lie in the way that we have come off the back of no less than four clear attempts to sustain the 250p level in recent months, as well as the ricochet off the 200 day moving average at 267p to underline the resumption of the bear trend. Indeed, it is probably the case that as little as an end of day close back below 204p will lead to a partial or even full retest of the initial support of June 24 at 164p over the next 2-4 weeks.
Small Caps
Avocet Mining (AVM): Above 20 Day Line Targets 120p
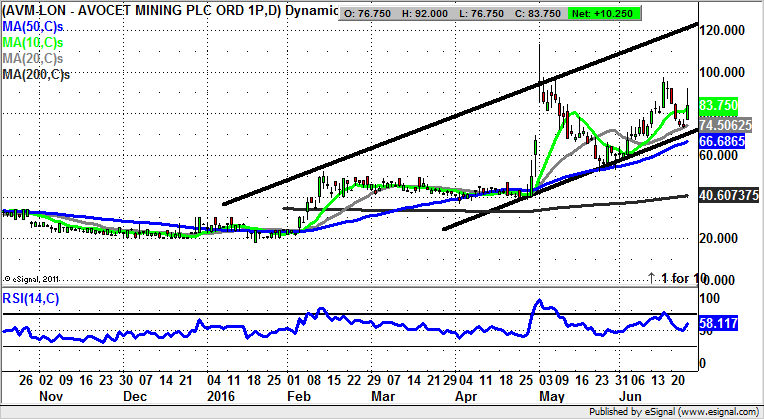
It is too much to resist cheering ourselves up with regard to the slump in the FTSE 100, with a look at the position of a couple of junior mining stocks which look set to continue their recent rallies. In the case of Avocet Mining it can be seen how there has been a rising trend channel ruling the roost on the daily chart from as long ago as the beginning of the year. The top of the channel is currently pointing as high as 120p, a decent 1-2 month target. This is valid while there is no end of day close back below the 20 day moving average at 74p.
Orosur Mining (OMI): Slow Burn Rally to 20p Plus
With Orosur Mining it could be said that we have a decent candidate for a small cap play which could flourish in the present risk off trading environment, where the gold price has soared. Indeed, there is the expectation of an ongoing journey within a rising trend channel from November last year. The top of the channel is pointing to 20p plus, a zone which could be hit as soon as the end of next month. Only a weekly close back below the 50 day moving average at just under 11p delays the upside scenario.

Comments (0)