Stocks Vs Bonds – Which Asset Class is Riskier?

The debate about risk lies too much around CAPM, standard deviation, beta and a few other concepts that are rarely capable of reproducing the true odds of achieving a certain investment goal. Unlike the concept of odds in football betting, which reflects the probability of a certain outcome occurring (even if a little distorted by the bookmaker over-round) and allows the gambler to determine with relative clarity a distribution of outcomes, asset prices don’t reveal much about the probability of achieving some price level or return. This is because such a situation requires a lot of assumptions to determine the same kind of distribution. It is on these assumptions that the modern portfolio theory is grounded, and it is from modern portfolio theory that the efficient market hypothesis was constructed to introduce the concept of beta as a key gauge of risk. But most of these assumptions have been extensively contradicted by empirical evidence, thus creating a black hole for investment decisions.
One of the key concepts stemming from efficient markets theory is beta: an investor is paid for the market risk he incurs; the higher this risk, the higher the expected return. Beta then predicts a positive relation between risk (or volatility) and returns. But despite the soundness of such a concept, the empirical evidence shows that beta is flat, and that more risk isn’t always accompanied by greater returns. Several anomalies were found across the years, such as seasonal effects, value effects, growth effects and momentum effects. There are so many distortions that it is impossible to even enumerate them here. To fit the old CAPM to these anomalies, Fama & French (1992, 1993) added two extra risk factors: size and value. They observed that low capitalisation stocks (size) and low book-to-market stocks (value) usually outperform other equities and that we need to control the risk-return relation by adding these two factors to the existing market risk. But notwithstanding these findings, researchers continued to find several anomalies that couldn’t be explained by this 3-factor model. Other models include the 4-factor Carhart (1997) model, which adds momentum to the above factors, and a reborn 5-factor Fama & French (2014) model, which includes the dubious “profitability” and “investment” factors. All these efforts are plain evidence of a complete failure to find a model that is able to capture all dimensions of risk. The main reason for this is the ill-conceived assumptions on which these models are grounded: the efficient market hypothesis. Investors behave erratically, with their actions often distorted by dozens of psychological biases rather than being rational at all times. The resulting market outcome would only by chance be efficient.
The risk paradigm is wrongly formed, ignoring some simple observations that completely change the risk profile of an investment. David Dreman (who has been featured in the November issue of MI magazine, p. 90) points to four issues: (1) liquidity, (2) leverage, (3) inflation, and (4) taxes.
The latest financial crisis (just like many others before it) is a great example of how the lack of liquidity increases risk. During periods of abundant monetary availability, banks and other credit institutions just ease their lending standards, which leads the economy towards an overall increase in leverage assumed. At the margin, lending is of very poor quality. At the first sign of economic retreat, this marginal lending will turn into bad loans. The more the lending expands, the greater the problems banks face when the economy shrinks (which it inevitably does at some point). Banks and authorities fail to scrutinise the quality of the loans in the good times. During subsequent periods of rapid downward movements, liquidity can decrease sharply or even dry up completely. This is because the lower the price, the lower the collateral values, and then, the greater the volumes investors need to dispose of in order to stabilise themselves. When everybody needs to sell at the same time, the market enters a vicious cycle, with investors being unable to dispose of the less liquid investments or having to accept large equity losses.
The EMH states that, as prices decrease, more and more investors enter the market, attracted by the lower prices. After all, lower prices offer higher expected returns, right? Not really! Unlike what happens during Black Friday, when consumers run climb over one another to get the huge discounts offered by retail stores, investors act in the exact opposite direction by getting rid of anything going down in price. Liquidity doesn’t increase as share prices fall sharply, as assumed by EMH, and thus the traditional risk-relation fails to account for this risk.
Leverage is another source of risk that is particularly powerful at interacting with liquidity. Many futures and derivatives markets allow investors to get a share of the market at a fraction of the total value. When leverage rises in the overall economy, the risk of a sudden crash also rises. What it means is that the risk when leverage doesn’t exist is not the same as when it does, and because of the interplay between leverage and liquidity, risk increases more than linearly with leverage. A proper risk-relationship needs to account for this feature.
While liquidity and leverage directly impact investments, they may not be as bad as depicted above, in particular when an investor keeps an investment for longer periods of time. Liquidity-driven crashes often recover in just a few months or less. Such a risk should not worry investors with 10-year or 20-year investment horizons. But we can’t say the same about inflation. The only reason for an investor to purchase stocks or bonds and keep them over time is because these investments are a store of wealth. People save in the present to increase their future spending; therefore an investment is worth its purchasing power or real return. If an investment returns 3% per year while inflation averages 7%, then an investor would be losing purchasing power over time. Inflation is a huge risk that should always be accounted for.
By the same token, we should then ask: what about taxes? The higher the taxes on any investment, the lower its net return. Taxes reduce the purchasing power of any investment and should therefore be accounted for in any risk assessment. Because the tax structure doesn’t affect all asset classes in the same way, we need to take account of these differences when trying to infer risk differences across asset classes.
David Dreman conducts a very simple analysis on how stocks, T-bills, and bonds performed between 1802 and 2010 in order to illustrate which are riskier investments. Unlike the traditional assertion about risk, what matters here is the inability of some investment to attain some return level. After all, what really matters is not the path taken by prices but rather the availability of some return level at the end of the investment horizon. Failure to attain that level is what represents risk.
Dreman estimated the odds (or probabilities) of stocks, T-bills and bonds beating each other in intervals up to 30 years, and after inflation is taken into account.
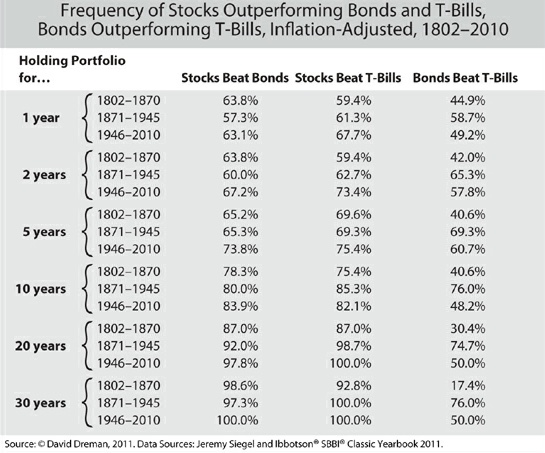
A portfolio of stocks has odds in favour of beating bonds and T-bills even in the shortest interval of just one-year. In the period after WWII, stocks beat bonds 83.9% of the time when we consider intervals of 10 years and 97.8% when we consider intervals of 20 years. The compound returns for the three asset classes for the period running after WWII shows just how astounding the performance of stocks was when compared with the performance of T-bills and bonds. Stocks had the edge over the other asset classes in every time interval.
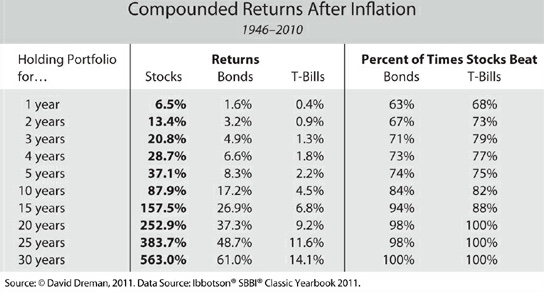
Dreman reports that if an investor put £100,000 into T-bills in 1946, it would have only £133,000 in 2010 after inflation is accounted for – a gain of 0.40% per year. The same amount invested in bonds would have returned 1.6% per year. This rate grows to 6.5% when we consider the same investment in stocks.
What about risk? In absolute terms, risk is given by the odds of not achieving a certain level of return. In relative terms, when we compare stocks with bonds and T-bills, risk is the odds of stocks underperforming the other two asset classes. The table above shows that, in the period 1946-2010, stocks outperformed bonds and T-bills 63% and 68% of the time in holding periods of just one year. The odds of underperforming are then 37% and 32% respectively. When holding periods of 20 years are considered, and for the same interval as above, the odds of stocks underperforming the other asset classes are almost zero. The longer the holding period, the lower the risk of holding stocks.
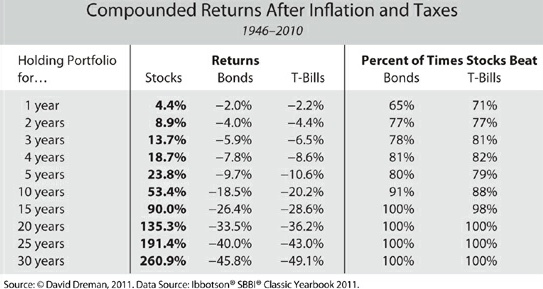
To complete this analysis, let’s now incorporate taxes. Dreman points out that someone in a 60pc tax bracket and holding a portfolio of £100,000 in bonds in 1946 would have only £27,000 left in 2010 after accounting for inflation and taxes. Compound returns for both T-bills and bonds for holding periods of up to 30 years all show a negative real net performance. Stocks outperformed both T-bills and bonds in every holding period bracket. When turning the relative performance into odds, the odds of stocks outperforming bonds and T-bills are around 80% in periods of just four years. This figure increases sharply to near 100% when we increase the holding period to 15 years.
An important conclusion that arrives from Dreman’s analysis is that bonds and T-bills are in fact riskier than stocks for any time-interval. The difference in riskiness sharply increases when we increase the holding period. The current risk paradigm based on the EMH completely fails to account for the true risk relation because it predicts markets to behave in the opposite way to which they in reality behave in reaction to a major downward price movement. At the same time, assets are valuable as a store of wealth, as a means of acquiring other assets in the future. For this sake, what matters the most is their real net return, when inflation is accounted for and taxes are paid. But when these are taken into account, bonds and T-bills simply fail to store wealth. This makes these asset classes riskier than stocks. If you don’t take too much leverage, you can probably forget about short-term volatility, as depicted by any beta or standard deviation metric. Your real risk is therefore the probability of not reaching your investment goal for the time period you define.
Comments (0)