Why are Kefi Minerals’ shares refusing to budge?

The Holy Grail of the junior mining sector is a miner still cheap but soon to generate the large cash inflow to justify the investment that bankers (and shareholders) will have put up to get it going. With this in mind, investors might be puzzled as to why Kefi Minerals’ (KEFI) shares show no signs of anticipating the start of its Tulu Kapi Ethiopian project. After all, it has gathered together all the permits, and has just put in place a key piece of the funding jigsaw, with two African development banks putting up $60m of the c. $130m needed to start construction this year (with production scheduled in late 2017). The remaining necessary funding is almost in hand, and the project is waiting for due legal process before all lenders can sign up simultaneously – KEFI reckons by the coming July – and, importantly, with no further funding required from shareholders.
Kefi has done well to improve Tulu Kapi’s economics since its acquisition for only £3m in late 2013. The up-front capex has been brought down from around $180m to some $130m, thereby increasing the project’s NPV8 to $197m at a $1,250/oz gold price, with a 50% IRR. The NPV falls to around $140m at the current $1,125 gold price with a 35% IRR; but this still indicates a well above average return and quick payback for investors. In addition, all-in costs of c. $740/oz of recovered gold are among the lowest quartile worldwide, so it is not surprising that it all seems set to go.
So why have the shares stalled, given that it is well known that the NPV (even at a low gold price) is 10 times Kefi’s current £9m market cap, and that the company has promised no recourse to shareholders for any more funds to get Tulu Kapi going (normally the only reason why investors stay wary). In any case, why have they fallen relentlessly during a time when Tulu Kapi’s economics was improving?
The answer, of course, is down to the dreaded ‘share dilution’, which in Kefi’s case has been extreme. It has been steadily hitting shareholders for more cash right up to only six weeks ago when a whopping 1:2 placing raised £2.6m “to cover corporate expenses and funds needed to finalise the Tulu Kapi start-up”, the supposed date of which has slipped by a whole year in only two years of Kefi’s ownership.
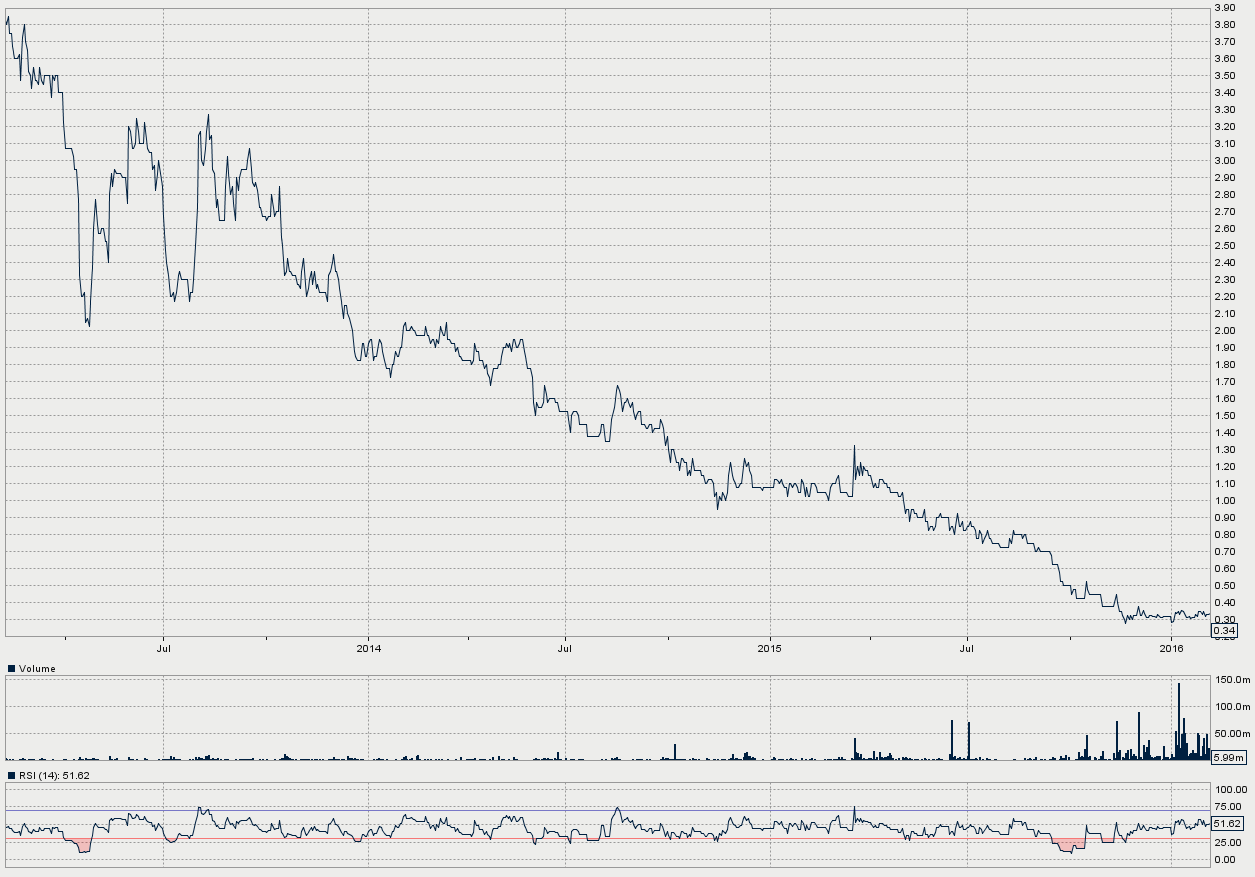
That £2.6m came on top of nearly £14m raised (including consideration for Tulu Kapi) at steadily lower prices in the four years since December 2011, when the market cap was £13m (versus £9m now). Shares in issue have seen a more than seven-fold increase (four-fold since Tulu Kapi), and as a result their price, at 0.33p now, is only 8% of their 2012 level, while the market cap has lost more than all the value contributed by shareholders. That is one of the worst examples I’ve found of ‘reality’ (the market cap, for which charts are never available) versus ‘illusion’ (the chart, which deceives investors into thinking shares must be historically cheap).
Also unhelpful was Standard Life’s steady sale during late 2015 of its (originally large) stake, although this was said to be to do with internal management of its portfolios and not specifically its opinion of Kefi.
But no wonder shareholders are cheesed off and bystanders are still wary.
So can we say that it is all, now, water under the bridge? Is there any more to come, or has disillusionment really plumbed the depths? Even the latest improvement in the economics reported in December hardly budged the shares. If there is no more share dilution; if Tulu Kapi really does start up in the middle of this year; and if the lending terms that Kefi has reported don’t change too much before financial close – might the shares be massively undervalued? Odey Investment Management who originally had a c. 14% stake, and then took 50% of the latest giant placing to give them 19.5% now, certainly seem to think so. But judging by the large recent trading volume when the share price has hardly budged, it looks as though many in the December placing might have been trading out of the shares.
Maybe that is because no analyst, as yet, has published any up-to-date estimate of what value will flow through to each share once Tulu Kapi starts. And that might be because of two uncertainties. One is the cost of the 10% gold hedging that Kefi has said will be used. The other, which is more complex, is the $40m of the funding total that Kefi has said will be plugged by gold streaming – that mechanism whose effects many investors may not understand. In return for putting up that $40m, the ‘streamer’ will take a proportion of the gold output for which it will pay a price substantially below the market price and so squeeze even more out of shareholders than the banks do!
But, then, we have already worked out the effects of such a deal for Lydian International (Master Investor December 14th) and can take that as a guide for Kefi.
The cost of the other funding is easily calculated. The Government of Ethiopia will put up some $20m for a c. 25% stake in the project itself, including its original 5% free carry (not in the listed plc), while it was previously announced that the $60m bank loan over six years would be at 9% interest.
As for streaming, we don’t yet have any details, but taking Lydian as a guide we can assume that the $40m will, in effect, be repaid over the 10 year life of the mine as if it is a loan that earns for the streamer the same rate of return as for Lydian – which at its assumed $1,150 gold price and a ‘strike’ price of $400/oz, earned for the streamer a rate of return of 12.5%. I assume an equivalent for Kefi at the same gold prices.
That 12.5% return to the streamer would come about if it takes almost exactly 10% of Tulu Kapi’s life-of-mine gold output (a total of 98,000 oz – for Lydian it was 142,000oz also over ten years, in exchange for $60m upfront) for which it pays $400/oz. So, my estimate seems to be on the right track.
On average, over ten years that is equivalent to Kefi paying an annual $7m p.a. in return for the $40m up-front – although, as I explained for Lydian, the higher the prevailing gold price, the higher the effective cost of the deal to Kefi. Some investors might baulk at that, but as with Lydian, it is the cost of putting all in place to get the project going.
With the estimate of the total cost of the funding we now have, the bottom line left over for Kefi shareholders can be calculated – although making things difficult is that while reporting the recently improved NPV and IRR, Kefi has not published an updated production profile. That previously gave the detailed operating results and cash generation quarter by quarter over a 13-year life (whereas the revised and improved economics are now for a ten-year mine life), but also highlighted one more aspect of Tulu Kapi that might cause some investors to be careful in their timing. The gold is not homogeneous, resulting in production and cash flow (and therefore earnings per share) which fluctuate considerably over the mine’s life, even though on average it produces the stated NPV and IRR.
This chart of the original quarterly cash flow profile over a 13-year life given in the Aug DFS shows what I mean:
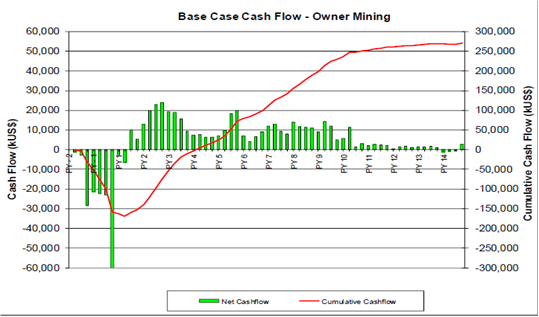
Compared with the 13-year profile, and because total gold output is to be almost the same, it seems that the latest improved economics over 10 years stems from bringing forward the last three years of very low production (at near break-even) in the original plan. One wonders why that wasn’t done in the first place.
No doubt the company will soon publish the full, revised mining plan; but meanwhile we can take the original cash flow profile and the annual production figures from the August 2015 DFS, and tweak them to contract to a 10-year life so as to arrive at the revised, higher NPV and IRR published in January. I have also adjusted to a gold price of $1,125/oz from the $1,250/oz taken in the DFS. Deducting the calculated bank loan and interest repayments and the net effect of streaming (and allowing for the Ethiopian Government’s 25% share in Tulu Kapi itself) we can arrive at the cash flows per Kefi share (assuming no further dilution). (N.B. there are currently 2.63bn shares in issue plus 231m warrants and options.)
| Year | 1 | 2 | 3 | 4 | 5 | 6 | 7 | 8 | 9 | 10 | 11 | |
| cf/share (pence) | 0.1 | 1.6 | 0.4 | -0.1 | 0.6 | 0.0 | 0.5 | 0.7 | 0.6 | 0.3 | 0.2 |
The resulting cash flow per share each year is shown in the table. Note of course that this will differ from reported earnings, which will bear non-cash depreciation charges. (The DFS assumed the project would be tax-exempt, but the 7% government royalty has been allowed for in the figures.) Nor, due to the fluctuations quarter by quarter, can I forecast the exact figures as will be reported by the company each financial year.
Nevertheless, there you have it! On the assumptions spelled out, Kefi does appear to be extremely cheap at the current 0.33p share price. Assuming no further share dilution, the total net cash inflow per share after all charges over 11 years from production start is 4.9p.
Converting the calculation to present value at an 8% discount, the value at year one of those future cash flows is 3.3p per share – i.e. 10 times the present share price. And this is for gold at $1,150/oz. But given that 10% of its output is sacrificed to the streamer (and that 10% is to be hedged), and allowing for the Ethiopian Government’s 25% stake and 7% revenue royalty, Kefi shareholders will only benefit to the tune of 56% of any increased gold price above that.
Comments (0)